Exchange Ranking
 Top Exchanges
 24h Volume Ranking
 Popularity Ranking
 Exchange BTC Balance
 Proof of Reserves
 Decentralized Exchanges
 Funding Rate
 Funding Heatmap
 Liquidation Data
 Max Pain
 Long/Short Ratio
 Whale L/S Ratio
 Binance/Okex/Huobi L/S
 Bitfinex Margin L/S
 ETF Tracker
 Solana ETF
 XRP ETF
 Hong Kong ETF
 Bitcoin Treasuries
 Crypto Reversal
 Ethereum Reserves
 HyperLiquid Wallet Analysis
 Hyperliquid Whale Watch
 Large Transactions
 On-chain Movement
 Bitcoin ROI
 Stablecoin Market Cap
 Options Analysis
 News
 Articles
 Economic Calendar
 Features
 Wallet
 Contract Calculator


 Security
 Collections
 Watchlist
 Following
 SUI
SUI lost momentum after experiencing a sharp rise.
SUI fell back after recovering from an August low to the US$1.30 region. Jesse Olson pointed out that after the rally, there were potential sell signals on the daily chart. His analysis cited evidence of overbought K-lines, inverted K-lines, second-highest points, and falling trend indicators.
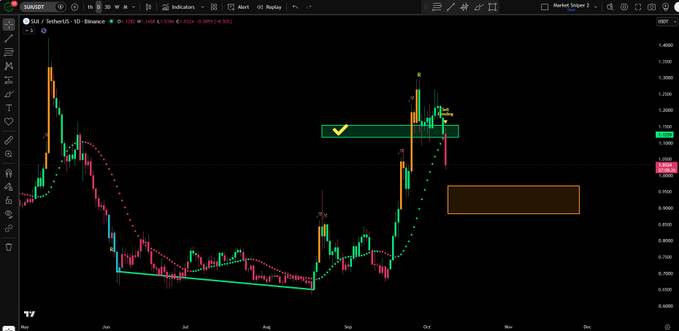
The daily chart shows that prices experienced prolonged declines between May and August. The price then bottomed out in the US$0.60 - 0.70 range and began to recover. The rally accelerated in September, pushing the token past the $1.00 mark and heading towards higher resistance.
However, the latest K-line shows the difficulty of maintaining upward momentum. The dotted trend indicator has also flipped, indicating that market conditions are weakening. Although these signals are positive warnings, they alone are not enough to confirm a continued shift in trends.
The chart marks the green support area near $1.10 - 1.15. Below it, the orange zone in the $0.88 - 0.98 area marks another historically price-intensive area. If prices continue to fall, this lower area may become the focus of attention, but this is not an inevitable result.
Falling prices accompanied by rising trading volume
The market dashboard provided showed that SUI was about US$1.07, down 4.95% in 24 hours. The intraday chart showed prices falling sharply from about $1.12 to around $1.00, before recovering to $1.07, but still below previous levels.
The 24-hour trading volume reached approximately US$1.05 billion, an increase of 50.12%. This increase suggests intensified trading activity during periods of weak prices. However, trading volume alone cannot determine whether the buyer or seller will dominate subsequent transactions.
The dashboard reports that the market value is close to US$4.41 billion. The fully diluted valuation is approximately US$10.73 billion, with 4.11 billion tokens in circulation. The total supply and maximum supply are both 10 billion SUIs, which means that there are still a large number of tokens that have not entered current circulation.
Another exchange dashboard record showed futures volume of US$1.48 billion and spot volume of US$322.25 million. The value of open interest was approximately US$833.34 million, indicating significant activity in the derivatives market. This data comes from separate snapshots and may use different statistical cycles.
Capital flow shows uneven market participation
The one-hour trading volume heat chart shows that Binance ranks first with approximately US$1.87 million. Kraken ranked second with US$1.53 million and OKX with approximately US$699,120. Gate and Coinbase are approximately US$652,890 and US$442,450 respectively.
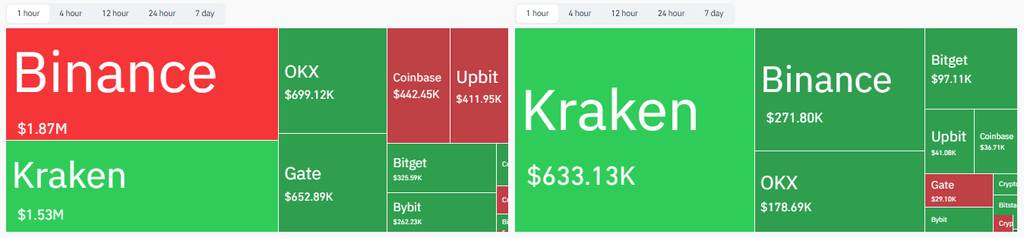
Some other exchanges contribute less to the trading volumes shown. Upbit's record was approximately $411,950 and Bitget's record was $325,590. Bybit's trading volume on the top ten exchanges is approximately US$262,230, with some figures being the largest.
Within the same market, the rankings of net capital flow heat maps vary. Kraken led the way with the largest positive net inflow (+633,130 $). Binance ranked second with $271,800 and OKX at approximately $178,690.
Positive net inflow means that the inflow is greater than the outflow during that time period. But they are not always indicators of value accumulation or future price movements. Transfers, liquidity management and transaction preparation can also affect exchange balances.
These two charts show the coexistence of slowing momentum and active trading, and the mixture of exchange capital flows. The intraday low of US$1.00 and important daily support areas provide a strong technical background. Future correction trends will deepen or stabilize, depending on changes in price behavior and market participation.