Exchange Ranking
 Top Exchanges
 24h Volume Ranking
 Popularity Ranking
 Exchange BTC Balance
 Proof of Reserves
 Decentralized Exchanges
 Funding Rate
 Funding Heatmap
 Liquidation Data
 Max Pain
 Long/Short Ratio
 Whale L/S Ratio
 Binance/Okex/Huobi L/S
 Bitfinex Margin L/S
 ETF Tracker
 Solana ETF
 XRP ETF
 Hong Kong ETF
 Bitcoin Treasuries
 Crypto Reversal
 Ethereum Reserves
 HyperLiquid Wallet Analysis
 Hyperliquid Whale Watch
 Large Transactions
 On-chain Movement
 Bitcoin ROI
 Stablecoin Market Cap
 Options Analysis
 News
 Articles
 Economic Calendar
 Features
 Wallet
 Contract Calculator


 Security
 Collections
 Watchlist
 Following
 SUI
Analysts pointed to a new four-hour SuperTrend buy signal from SUI, which had previously signaled a 77.53% gain.
Kyle Chasse reported that Sui used stablecoin gains to buy back approximately 830,300 tokens, but the total purchase value has not yet been announced. Currently, SUI is trading at around $1.123, slightly below its 50-day moving average of $1.14, resistance is at $1.20 and the $1.25 - 1.29 range, and support is around $1.05.
Ali Charts prompts new SUI buy signal
According to Ali Charts, the SuperTrend indicator sends a buy signal on the SUI's four-hour chart. The analyst said the last time a similar signal signaled a price increase of 77.53%. However, previous rallies do not establish how SUI will perform after this latest signal.
The current price structure provides an additional reference level for traders monitoring this setups. As of October 12, 2026, SUI was trading at approximately $1.123, slightly below its 50-day moving average of $1.14. However, the token is still above its 200-day moving average of $0.991.
Sui uses stablecoin earnings for token repurchase
Kyle Chasse reports that Sui used stablecoin earnings to repurchase approximately 830,300 tokens. He said the purchases used interest income rather than venture capital funds or treasury withdrawals. Chasse also linked potential future buybacks to stablecoin activity on Sui. He questioned how big the number of tokens repurchased would become if stablecoin trading volumes continued to rise.
His comments clarified that stablecoin gains were the source of funding for this reported purchase. However, the information provided did not clearly state the repurchase schedule or the total value of the tokens received.
SUI faces resistance between US$1.14 and US$1.29
SUI's recent price movement follows long-term declines in May and June. The token consolidated in the US$0.66 - 0.75 range between late June and July, before attempting to recover in August. In late September, SUI rose from approximately US$0.75 - 0.85 to above US$1.20, briefly touching US$1.28 - 1.29.
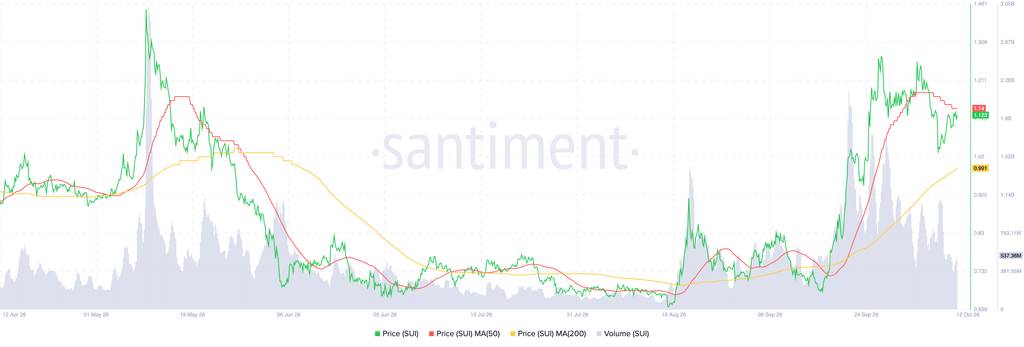
Trading volume also surged significantly during this period, before resistance triggered a correction and prices fell back towards $1.05. Prices have since recovered to about $1.123. The moving average of $1.14 constitutes direct resistance, while $1.20 and $1.25 - 1.29 are high levels to watch.
However, if the price encounters a rejection below $1.14, support levels near $1.05 and $0.99 could be exposed. If it falls below US$0.99, the market focus will shift to US$0.90.