Exchange Ranking
 Top Exchanges
 24h Volume Ranking
 Popularity Ranking
 Exchange BTC Balance
 Proof of Reserves
 Decentralized Exchanges
 Funding Rate
 Funding Heatmap
 Liquidation Data
 Max Pain
 Long/Short Ratio
 Whale L/S Ratio
 Binance/Okex/Huobi L/S
 Bitfinex Margin L/S
 ETF Tracker
 Solana ETF
 XRP ETF
 Hong Kong ETF
 Bitcoin Treasuries
 Crypto Reversal
 Ethereum Reserves
 HyperLiquid Wallet Analysis
 Hyperliquid Whale Watch
 Large Transactions
 On-chain Movement
 Bitcoin ROI
 Stablecoin Market Cap
 Options Analysis
 News
News Articles
 Economic Calendar
 Features
 Wallet
 Contract Calculator


 Security
 Collections
 Watchlist
 Following
 ADA
ADA  ETH
ETH  XRP
XRP Ethereum, Ripple and Cardano opened on September 5, and prices are still trapped in a consolidation structure.
With the release of U.S. non-farm payrolls data yesterday brought new fluctuations, Ethereum, Ripple (XRP) and Cardano entered trading on September 5 with prices trapped in a consolidation structure. None of these three cryptocurrencies has achieved a convincing breakthrough from the current range, making several key price points worthy of focus today.
Ethereum prices have rebounded to the middle of their broader range, with Ripple prices still close to an important support area, while Cardano prices have retreated from yesterday's high. Technical indicators also showed a mixed picture across all three assets, with MACD readings remaining positive despite other momentum indicators showing continued selling pressure. This combination may make today's key support and resistance levels particularly important. The following is an analysis of Ethereum, Ripple and Cardano in charts and technical indicators.
Ethereum prices remain within their larger consolidation range
Ethereum prices continue to trade within a broader consolidation structure of US$2,350 to US$2,540. Yesterday prices pulled ETH back into the middle band after failing to try to build a stronger trend at the top of the range. The release of U.S. non-farm payrolls data pushed Ethereum prices lower to around $2,430. ETH then rebounded slightly and traded sideways between $2,444 and $2,459.
Current momentum could keep Ethereum in the middle of consolidation, with $2,415 and $2,490 forming the main boundaries. A break below $2,415 could expose an area of about $2,356 below. <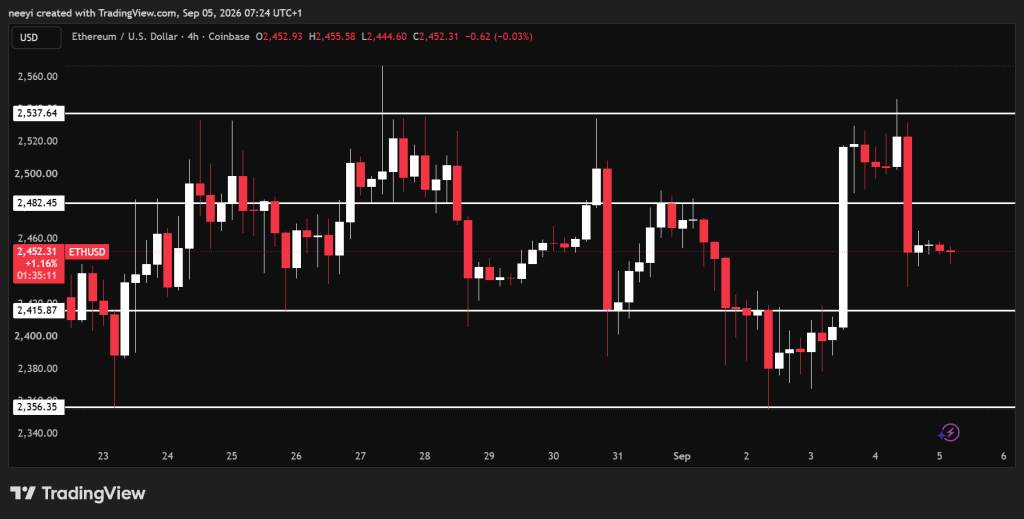 >
>
Ethereum bulls need different results to regain control. A breakthrough of about $2,482 could open a path to $2,537 before the end of the day.
Ethereum's technical specifications provide mixed signals. The RSI of 50.124 places ETH almost directly in the neutral zone. Therefore, based on the RSI alone, neither buyer nor seller has a significant momentum advantage.
MACD provided the strongest positive reading of 4.23. A positive MACD reading favors buyers and supports the possibility of testing resistance again if Ethereum prices remain above recent support.
The Ultimate Oscillator is at 40.315 with a sell signal. This level indicates weak potential momentum, making an immediate upward breakthrough less credible.
Bull/Bear Power is also negative,-13.3439. Therefore, despite the positive MACD reading, sellers still maintain some control over short-term price movements.
Today's (September 5) Ethereum price forecast
Bullish scenario: Ethereum prices broke through $2,482 and moved towards the upper area of approximately $2,537.
Neutral scenario: ETH remains within the middle consolidation band of approximately US$2,415 to US$2,490.
Bear scenario: Ethereum loses US$2,415 support and moves towards the lower support area of approximately US$2,356.
Ripple consolidation makes US$1.37 and US$1.47 key levels
Ripple has a similar structure before the opening of trading on September 5. The cryptocurrency is still in a broader consolidation pattern, which can be divided into three regions: lower, middle and upper.
Attempts to get to the top failed yesterday. The release of non-farm payrolls data pushed XRP lower to around $1.38, and prices subsequently stabilized. Current conditions make $1.37 and $1.47 important boundaries today. Continued lateral movement could keep XRP prices within that range. <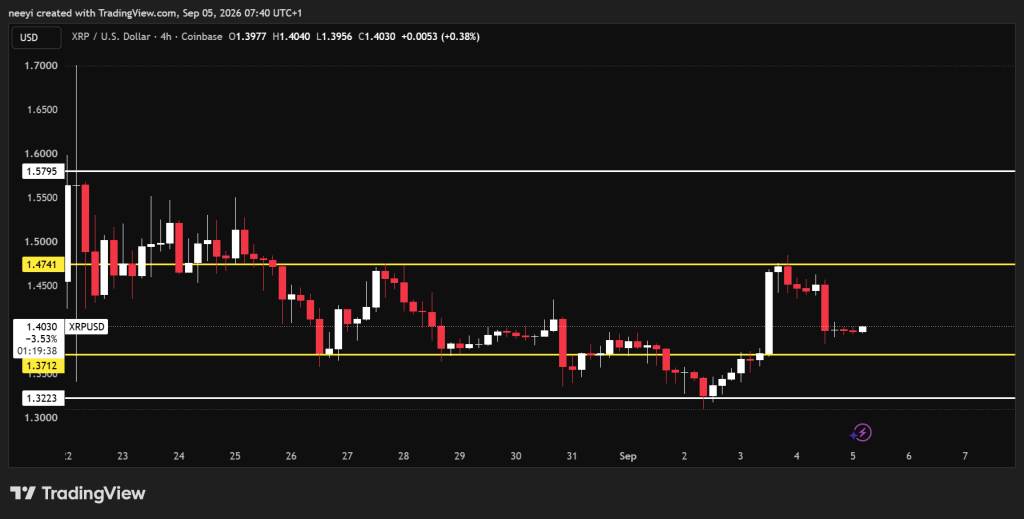 >
>
A convincingly breakthrough of US$1.47 will change the short-term structure and may open a path to US$1.57. A break below $1.37 would have the opposite situation and could expose support at around $1.32.
The RSI reading for XRP is 51.238, which is almost neutral. The reading was slightly above the midpoint, but was not enough to confirm that buyers control the market.
The MACD is 0.006 with a positive reading. This gives XRP some potential bullish momentum, a factor that could become even more important if the price tests $1.47 again.
The final oscillator is 44.312. Its sell signal suggests that overall momentum is weaker than the level indicated by MACD alone.
The power of the bull-bear is-0.0052. Negative values also slightly favor sellers, which helps explain why XRP prices have struggled to build a stronger recovery.
Today's (September 5) Ripple price forecast
Bullish scenario: XRP broke through $1.47 and moved towards $1.57 before the end of the day.
Neutral scenario: XRP continues to consolidate between approximately $1.37 and $1.47.
Bear scenario: XRP loses support at around $1.37 and moves towards the next important level nearby,$1.32.
Cardano faces bearish pressure near US$0.208 support
Cardano maintains a similar consolidation structure, although its instant price movement looks weaker than Ethereum and Ripple. [TAG ADA reached around $0.22 yesterday before moving lower. Cardano prices are currently trading around $0.212, which puts the cryptocurrency close to an important support area.
The $0.208 level may determine whether the current decline extends further. A break below this zone could expose $0.203, the next important level in the broader consolidation structure.
The buyer needs a recovery of US$0.215 on Cardano's price to improve the short-term situation. Breaking through that resistance could allow the ADA to return to yesterday's $0.22 region before the end of the day. <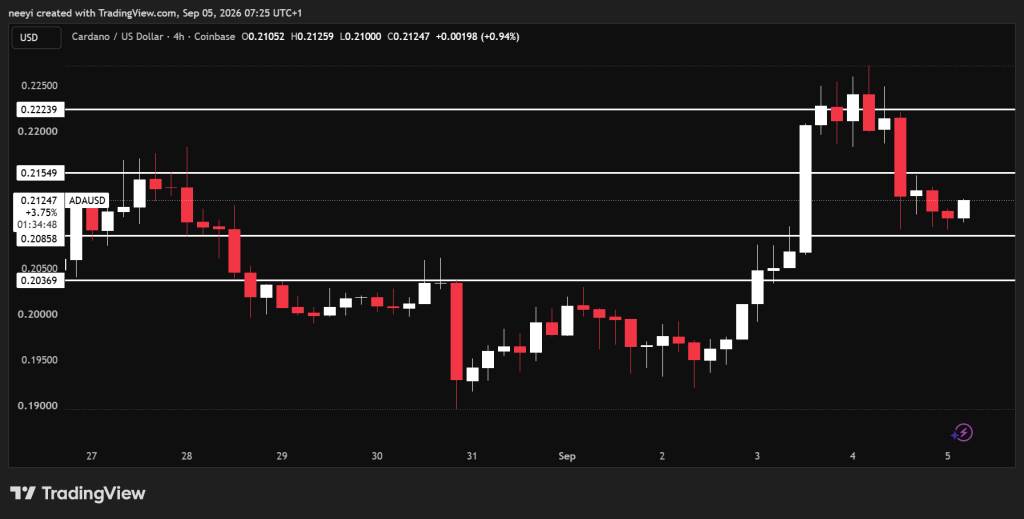 >
>
Cardano's RSI is currently 53.168. This reading remains neutral, although it lies above 50, giving the buyer a slight kinetic energy advantage.
The MACD is 0.003, providing another positive reading. This means that the ADA still has some bullish momentum behind its recent decline, although prices need to regain resistance for the reading to be more convincing.
The final oscillator is 44.14 with a sell signal. This suggests weak momentum over multiple time periods and supports caution around the current decline.
The power of the bull-bear is-0.0012. Therefore, even though the RSI is neutral and the MACD is positive, the seller still maintains a slight advantage.
Today's (September 5) Cardano price forecast
Bullish scenario: Cardano price broke through US$0.215 and moved towards yesterday's area of approximately US$0.22.
Neutral scenario: ADA continues to consolidate between approximately $0.208 and $0.215.
Bear scenario: Cardano loses US$0.208 support and moves towards the next support area at approximately US$0.203.
FAQs
Will Cardano (ADA) reach $10?
Mainstream prediction models and major analysis platforms believe that in the short to medium term, the possibility of Cardano (ADA) reaching US$10 is extremely low.
How much will an Ethereum be worth in 2030?
Expert forecasts for the 2030 Ethereum (ETH) price vary widely, with institutional base cases ranging from US$3,000 to US$22,000 per token, and extremely bullish forecasts reaching US$40,000. Due to the highly volatile and speculative nature of the cryptocurrency market, there is no single consensus number.