Exchange Ranking
 Top Exchanges
 24h Volume Ranking
 Popularity Ranking
 Exchange BTC Balance
 Proof of Reserves
 Decentralized Exchanges
 Funding Rate
 Funding Heatmap
 Liquidation Data
 Max Pain
 Long/Short Ratio
 Whale L/S Ratio
 Binance/Okex/Huobi L/S
 Bitfinex Margin L/S
 ETF Tracker
 Solana ETF
 XRP ETF
 Hong Kong ETF
 Bitcoin Treasuries
 Crypto Reversal
 Ethereum Reserves
 HyperLiquid Wallet Analysis
 Hyperliquid Whale Watch
 Large Transactions
 On-chain Movement
 Bitcoin ROI
 Stablecoin Market Cap
 Options Analysis
 News
News Articles
 Economic Calendar
 Features
 Wallet
 Contract Calculator


 Security
 Collections
 Watchlist
 Following
Pi Network Project Overview and Latest Market Trends
Pi Network was launched as a mobile-first cryptocurrency project that aims to make mining popular through smartphones rather than dedicated hardware. The project will move to the open mainnet phase in 2025, allowing PI to trade freely on major exchanges. Currently Pi Network's price forecast analysis shows that the current trading price of $PI is $0.09442, which has dropped 0.8% in the past 24 hours. The current market value of the token is approximately US$1.052 billion, with a circulation supply of 11.142 billion, and the maximum supply of 100 billion.
Real-time market data
Indicators| Value
Current price: $0.09442
24-hour change: -0.8%
24-hour range: $0.0937 - $0.09628
Market value: $1.052 billion
Fully diluted valuation: $1.619 billion
24-hour transaction volume: $6.145 million
Circulation supply: 11.142 billion
Total supply: 17.141 billion
Maximum supply: 100 billion
Data source: Pi market value data is obtained from CoinGecko, as of September 5, 2026. Data from different tracking sites may vary slightly.
Drivers of community heat recovery
This week, community discussions around Pi Network have become increasingly intense as the Pi Network token climbed to the top of the OKX Hot Asset Chart, surpassing Bitcoin, Ethereum and many other major cryptocurrencies. Commentators point out that although PI prices have weakened slightly, the increased attention suggests that this interest stems from the progress of the project itself, rather than just short-term price momentum.
 Several updates seem to have driven this wave of renewed attention. According to reports, OpenPay's cash deposit feature is being restored, which will allow Pioneers (pioneer users) to more directly exchange PI into fiat currencies. In addition, another integrated development called RoboPay aims to allow users to use $PI to pay for services such as delivery and inspection. In addition, App Studio has apparently shifted its fee structure from a fixed subsidy model to a model tied to actual AI usage costs, which some believe is an effort to build a more sustainable development ecosystem around the network.
Pi Coin Forecast: Technical Analysis
The 4-hour chart shows that Pi Network's price forecast trend has remained within a well-defined upward channel since late August. Prices recently encountered a rejection after hitting the upper boundary of the channel, and then pulled back to near the midpoint.
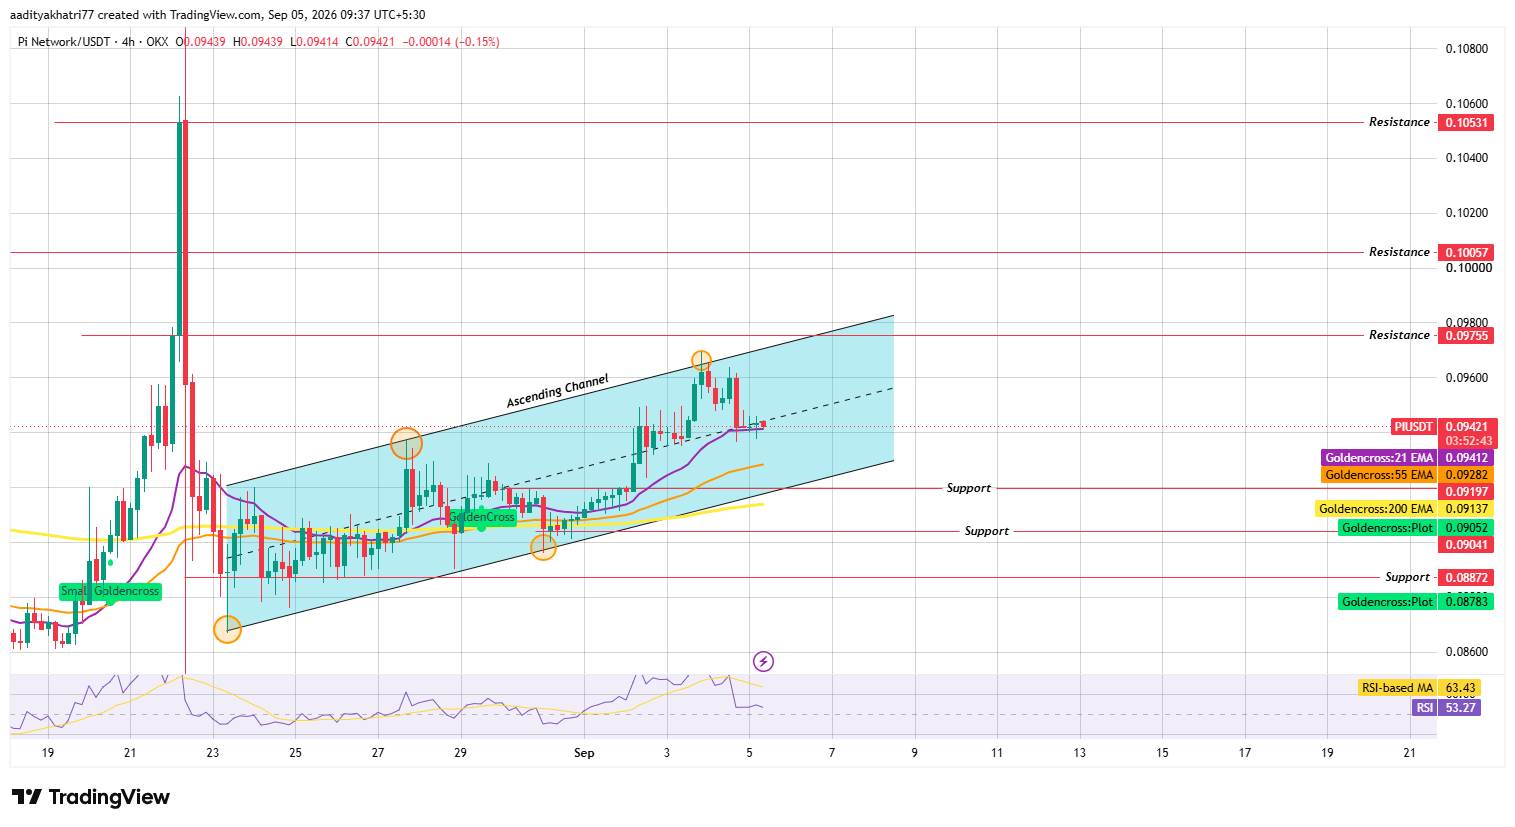 Currently,$PI is testing the 21 EMA (exponential moving average) at $0.09412, which is slightly below the current price on the chart of $0.09421. The 55 EMA is at the lower of $0.09282, while the 200 EMA is at $0.09137, forming a layered support structure below the price.
Bullish scenario:
If the price rebounds from the 21EMA with volume support from the 4-hour K-line closing confirmation and then breaks through the upper boundary of the rising channel, the next resistance target will be $0.09755, followed by $0.10057 and $0.10531.
Bear scenario:
If prices cannot hold on to 21EMA and continue to fall through 555EMA and 200EMA, and the K-line closes below the lower boundary of the channel, the downside target will shift to the support clusters of $0.09197,$0.09052 and $0.08872.
The RSI currently reads at 53.27, which is in the neutral range, while the moving average based on the RSI is at the higher level of 63.43. This gap suggests that momentum has cooled slightly from recent highs, but has not yet turned into a clear bearish trend.
Support and Resistance Levels
Type| Horizontal
Resistance 3:$0.10531
Resistance 2:$0.10057
Resistance 1:$0.09755
Support 1:$0.09197
Support 2:$0.09052
Support 3:$0.08872
EMA Levels (4-hour chart)
EMA |Price
21 EMA: $0.09412
55 EMA: $0.09282
200 EMA: $0.09137
Glossary
Ascending Channel: A chart pattern formed by two parallel upward sloping trend lines, with prices moving between an upward support line and an upward resistance line.
EMA (Exponential Moving Average): A type of moving average that gives more weight to recent price data, making it more responsive to new information than a simple moving average.
RSI (Relative Strength Index): A momentum indicator that measures the speed and magnitude of recent price changes, usually used to identify overbought or oversold conditions on a scale of 0 to 100.
Golden Cross: The pattern of the short-term moving average crossing the long-term moving average is usually interpreted as a bullish signal.
Pi Coin vs. Bitcoin
During recent trading hours, Pi Network's price behavior has shown limited direct correlation with Bitcoin, a divergence that has been particularly prominent in its recent hot performance. While Bitcoin price movements usually set the tone for broader market sentiment, the PI's climb to the top of the OKX hot list is driven by useful news on specific projects, independent of the main Bitcoin price movements today. This suggests that, at least in the short term, PI's price forecast outlook may be influenced more by ecosystem developments than Bitcoin's own trajectory.
Expert opinion
Market commentators tracking Pi Network's recent hot performance point out that the project's overtaking Bitcoin and other major assets on OKX reflects emerging interest related to practicality rather than pure price speculation. This view is consistent with the technical setting, where price consolidation in the upward channel suggests that the market may wait for a clearer catalyst before committing to direction.
Disclaimer
This Pi Network price forecast is based on technical chart analysis and current market data and should not be considered financial advice. The cryptocurrency market is extremely volatile, and actual price changes may deviate significantly from forecast scenarios. The support and resistance levels discussed in this paper represent probability intervals rather than guaranteed outcomes, and there are downside risks at every stage of this analysis. Readers should conduct independent research before making investment decisions.