Exchange Ranking
 Top Exchanges
 24h Volume Ranking
 Popularity Ranking
 Exchange BTC Balance
 Proof of Reserves
 Decentralized Exchanges
 Funding Rate
 Funding Heatmap
 Liquidation Data
 Max Pain
 Long/Short Ratio
 Whale L/S Ratio
 Binance/Okex/Huobi L/S
 Bitfinex Margin L/S
 ETF Tracker
 Solana ETF
 XRP ETF
 Hong Kong ETF
 Bitcoin Treasuries
 Crypto Reversal
 Ethereum Reserves
 HyperLiquid Wallet Analysis
 Hyperliquid Whale Watch
 Large Transactions
 On-chain Movement
 Bitcoin ROI
 Stablecoin Market Cap
 Options Analysis
 News
News Articles
 Economic Calendar
 Features
 Wallet
 Contract Calculator


 Security
 Collections
 Watchlist
 Following
 ADA
ADA Cardano price forecast: The RSI signal has sparked heated discussions in the market, and key resistance levels determine the short-term trend.
Currently, a bold saying is circulating in the cryptocurrency community that has attracted traders to Cardano more than ever. The forecast discussion about Cardano prices heated up sharply after a widely circulated post pointed to the ADA's once-in-eight relative strength index (RSI) pattern. Such signals are extremely rare in history and usually appear every long time. Whenever such technological forms begin to become a trend, the charts behind them often hide information worthy of attention, and this time is no exception. Before rushing to conclusions, it is crucial to understand what the ADA chart currently displays, the latest Cardano news, and the true trigger price points. The following is a detailed analysis.
Today's Cardano Price: Real-time ADA Data and 24-Hour Changes
As of this writing, based on Binance's daily chart, ADA's trading price is approximately US$0.2179. Over the past 24 hours, Cardano futures volume reached $751.79 million and spot volume reached $143.17 million, indicating that both derivatives traders and spot buyers are actively participating in the current ADA price forecast narrative. Cardano's market value remains at around $8.01 billion, with open interest of $465.13 million, reflecting how much leveraged positions are betting on the market. The circulation supply is 36.73 billion ADAs, the total supply is 44.99 billion, and the maximum supply limit is 45 billion, which means that most of Cardano's final token supply has entered the circulation field.
Data source: CoinGlass, Cardano Data, September 8, 2026
Cardano News: ADA RSI signals inspire bold price target discussions
The biggest topic point in Cardano's latest news this week comes from a post posted by "Cardano Feed" on the X platform on September 8, 2026. The post highlighted the so-called eight-year RSI signal appearing on the ADA and demonstrated via video a potential for a possible rush to $2.90, describing it as a potential move up about 14 times from current levels. The post has received thousands of views and dozens of likes in a short period of time, showing the market's strong interest in bullish Cardano trend analysis. What needs to be sobering is that the long-term RSI pattern is indeed an interesting technical observation, but setting specific dollar targets and multiples in such a radical way reflects more the enthusiasm of the community than the established results. Such Cardano price forecast updates should be seen as one of many data points rather than a commitment to the ADA's future direction.
Image source: Cardano Feed (@CardanoFeed) on X, September 8, 2026 at 4:12 pm
ADA Quick Overview: Today's key triggers and support levels
- Current market price (CMP): US$0.2179 (Currency Security Daily Chart)
- Weekly resistance trigger: Need to break through and close above US$0.2587 to start the next wave of gains
- Weekly support triggers: Need to break below and close below US$0.1895 to turn the bias to bear
- Data Timestamp: September 8 to September 9, 2026
- Risk Warning: Given the US$465.13 million open contract amount, leveraged positions are high, so the volatility may be greater than usual regardless of the direction
Cardano Technical Analysis: ADA Price Forecast and Trend Outlook
Check out Binance's ADA daily chart, its structure tells a much clearer story than the title suggests. 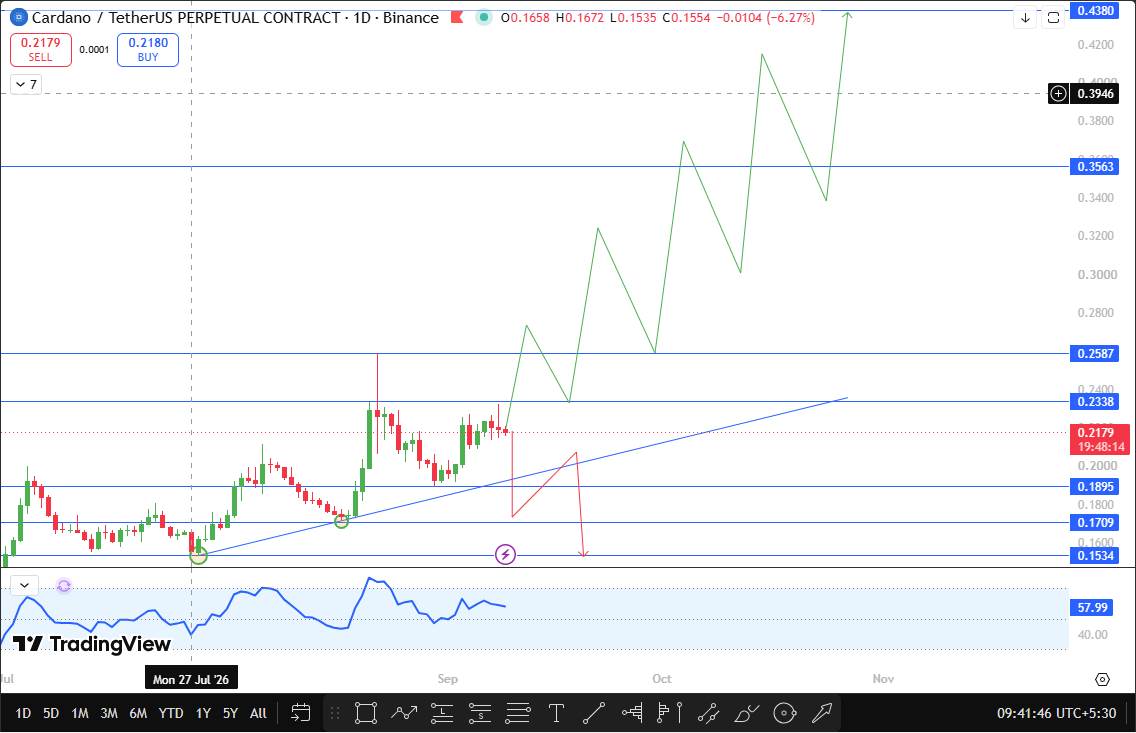 Prices built an uptrend line at low points, and after first backtesting of the trend line, they then showed a truly aggressive rally rather than a slow climb. This sharp pulsed rally after a clean trend line backtest usually indicates a strong interest in buying to intervene at critical moments, which is one of the main reasons why the recent Cardano price outlook has been biased towards a positive.
Currently, the ADA remains stable below the key resistance area rather than falling directly, which in itself is a meaningful signal. Rejections here are usually accompanied by rapid, sharp declines, but this has not yet happened. Instead, prices are holding their ground near resistance, and this consolidation below the ceiling often signals a prelude to an attempt to break through.
If the ADA is able to stand firm above $0.2587 at the close, it will confirm a breakthrough pattern and open the door for a next look at $0.3563, which is approximately 63.5% higher than the current price. If momentum extends above this level, the next major target in this ADA price forecast will be $0.4380, approximately 101% above current market prices. These are not small movements, and reaching these positions requires continued buying pressure over multiple trading days, not just a green candle.
On the other hand, if $ADA fails to hold on to footing and closes below $0.1895 on the daily chart, it indicates that the current rally is fading. In this case, the next support level to pay attention to is US$0.1709, which is about 21.6% lower than the current market price, and the lower level is US$0.1534, which is about 29.6% lower than the current level. A closing below $0.1895 alone represents a nearly 9% pullback from the ADA's current position, so this is not a distant or unrealistic support test.
Currently, technical analysis will favor the bulls as long as the ADA can maintain near resistance without being rejected by outright, but the US$0.2587 level is still the real watershed for this Cardano price forecast to unfold as expected.
Image source: TradingView, ADA/USDT Perpetual Contract, Binance, Daily Chart, September 8, 2026
ADA Support and Resistance Levels to Focus on
Tier Type Price vs. CMP ($0.2179) Change Main resistance 2 $0.4380 + 101.0% Main resistance 1 $0.3563 + 63.5% Breakout trigger level $0.2587 + 18.7% Current market price $0.2179 -Breakout trigger level $0.1895 -8.9% Support 1 $0.1709 -21.6% Support 2 $0.1534 - 29.6% ADA price forecast scenario: bull market, benchmark and bear market cases
bull market case: $ADA remains solid near current resistance levels, buyers continue to enter during any pullbacks, and prices eventually close above $0.2587. This would confirm a breakthrough structure, making $0.3563 a feasible target, with $0.4380 an extended target if the rally maintains its current strength. This scenario will also provide some technical endorsement (although not confirmation) for the bold Cardano price forecast circulated on social media this week.
Benchmark case: The situation is relatively flat, but it is more likely to occur in the short term.$ ADA continued to fluctuate below US$0.2587, testing resistance many times but failed to effectively break through, while avoiding falling below US$0.1895. This kind of lateral consolidation near key levels is common before true directional movements, which means patience is better than a strategy of chasing extreme trends.
Bear market case: If buyers lose interest and $ADA slips below $0.1895 at the daily close, this scenario holds. This would erase most of the recent bullish structure and shift attention first to $0.1709 and further to $0.1534 if selling pressure intensifies. Traders currently bullish on ADA want to see the level strengthen rather than rupture.
Risks of this Cardano price outlook
The crypto market can move quickly in both directions, and Cardano is no exception. The RSI signals discussed online add emotional fuel, but an emotion-driven rally could reverse as quickly as it did with buildup, especially considering that there are currently up to $465.13 million in open interest positions. Broader market conditions, Bitcoin's own price movements, and any sudden shift in risk appetite in the crypto market could overwhelm the specific currency technology form described here. This article is for information only and should not be regarded as financial advice.
Cardano price forecast key terms
- Ascending Trendline: A series of rising lines connecting higher lows are used to identify where buying intervenes in an uptrend.
- Breakout: When prices decisively cross resistance levels with strong volume, it usually marks the beginning of a new uptrend.
- Support and Resistance: Historically, price ranges where buying or selling pressures are strong enough to pause or reverse movement.
- Open Interest: The total number of outstanding derivative contracts, which is used to measure the amount of leveraged funds active in the market.
- RSI (Relative Strength Index): A momentum indicator used to measure whether an asset may be overbought or oversold based on recent price movements.