Exchange Ranking
 Top Exchanges
 24h Volume Ranking
 Popularity Ranking
 Exchange BTC Balance
 Proof of Reserves
 Decentralized Exchanges
 Funding Rate
 Funding Heatmap
 Liquidation Data
 Max Pain
 Long/Short Ratio
 Whale L/S Ratio
 Binance/Okex/Huobi L/S
 Bitfinex Margin L/S
 ETF Tracker
 Solana ETF
 XRP ETF
 Hong Kong ETF
 Bitcoin Treasuries
 Crypto Reversal
 Ethereum Reserves
 HyperLiquid Wallet Analysis
 Hyperliquid Whale Watch
 Large Transactions
 On-chain Movement
 Bitcoin ROI
 Stablecoin Market Cap
 Options Analysis
 News
News Articles
 Economic Calendar
 Features
 Wallet
 Contract Calculator


 Security
 Collections
 Watchlist
 Following
 HBAR
HBAR Hedera quietly returns to focus: Full analysis of HBAR price forecast and market dynamics
Hedera (hash) has quietly returned to the focus of market attention. Those who have followed the Hedera price forecast discussion this week may have noticed the renewed buzz over HBAR. The chart tells the story of "patience pays off", a pattern that has been repeated many times in the past few weeks, and the current pattern looks like the next decisive move is brewing. Traders are keeping a close eye on a specific structure as they search for new HBAR forecasts, and the performance of the next few K-lines will determine the direction of sentiment in the broader altcoin market in the coming days. The following is the complete market picture.
Hedera Prices Today: Real-time Data and 24-Hour Changes
As of writing, HBAR's trading price was US$0.07455, down 0.94% in the past 24 hours. This is a mild correction after a period of volatile but resilient price action. The market value of the token is currently US$3.26 billion, and the circulation supply is 43.83 billion HBAR, with the total supply and maximum supply being 50 billion. Trading activity remained healthy, with 24-hour futures volume of US$87.68 million, spot volume of US$24.91 million, and open interest values in the derivatives market were US$105.1 million. This level of open interest suggests that traders are actively positioning positions around HBAR rather than sitting on the sidelines, which often adds momentum to the direction of the next wave of breakthroughs.
Source: CoinGlass, Hedera Market Data, as of September 12, 2026.
Hedera Update: ETF inflows show increased confidence
The latest Hedera news is quite optimistic for HBAR holders. According to a BSCN post on the X platform, Canary's spot Hedera ETF attracted a net inflow of $818,000 on September 10, continuing the product's strong performance. 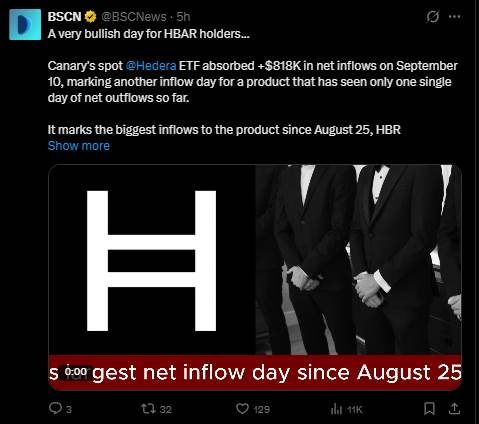 It is worth noting that this is the largest inflow in a single day since August 25, and there has been only one day of net outflow since its launch. This consistency is rare for a newer spot product, suggesting that even if spot prices cool slightly, there is still stable institutional demand building up at the bottom. For currencies whose trend analysis often relies on changes in sentiment, continued ETF inflows are often seen as a silent vote by allocators not to chase short-term price fluctuations.
Source: BSCN released through the X platform, data was imported on September 10, 2026.
Quick Summary
[TAG_3 7]HBAR Technical Outlook: Next Major Trend Analysis
Zoom in on the 4-hour chart on Binance, HBAR has been steadily climbing along the rising trend line for most of the past month. 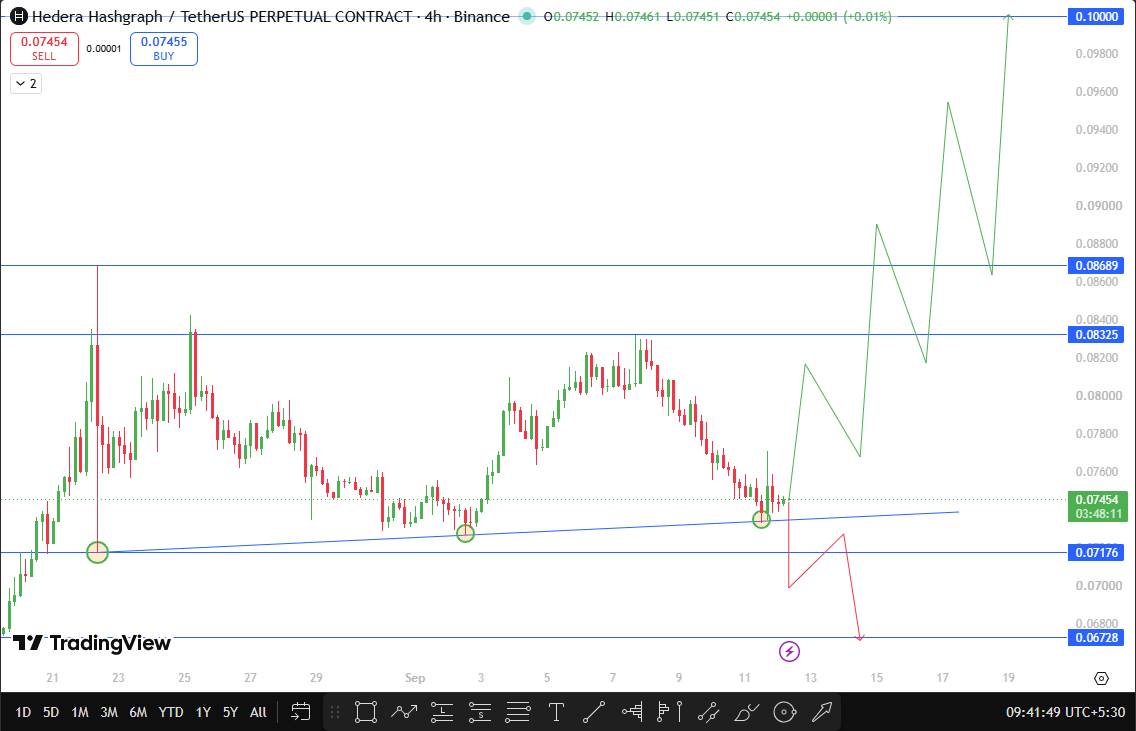 The form here is noteworthy because it has proved its effectiveness twice. Prices found support at this trend line for the first time in late August and rebounded, pushing prices higher. Prices then fell back and tested the rising line for the second time in early September, when buyers stepped in again at the right time. Now, HBAR is approaching that trend line for the third time, retesting it from a slightly higher level than before, which is usually a sign that the market is accumulating energy for the next expansion rather than losing steam.
If HBAR can hold on to the trend line again without breaking below $0.07176, the first resistance path to $0.08325 will be opened. After cleanly breaking through the area, the next target will be $0.08689. If buyers can maintain momentum beyond that level, the main psychological resistance level and clear dividing line will be $0.10,000, a significant target relative to current pricing. On the other hand, if HBAR fails to defend the trend line, but breaks below and closes below $0.07176, the structure will change and the next support level to watch is $0.06728.
This is a textbook trend following setting, and the fact that HBAR repeatedly tests the same rising line without breaking it adds to the reason for bullish, but nothing is certain until prices actually confirm the close.
Source: TradingView, Hedera/TetherUS Perpetual Contract Chart, Binance, September 12, 2026, UTC+5:30 09:41.
HBAR Support and Resistance
Type Price Approximate percentage from current price Support $0.07176 -3.7% Support (Break)$0.06728 -9.7% Resistance 1 $0.08325 +11.7% Resistance 2 $0.08689 + 16.6% Main Resistance $0.10000 + 34.2% HBAR's bullish, benchmark and bearish scenarios
In the bullish scenario,HBAR continues to respect its uptrend line, and stable ETF inflows combined with a technically sound support area pushed prices past US$0.08325 and eventually towards the US$0.10000 mark. Once this level is exceeded, it may attract new attention from momentum traders.
In the benchmark scenario,HBAR will spend more time consolidating near the current trend line area, oscillating between $0.07176 and $0.08325, waiting for the market to either have a decisive catalyst or a clearer technical trigger before committing direction.
In a bearish scenario,The trend line finally gave way and HBAR slipped below $0.07176, opening the door to $0.06728. Even in this case, the potential ETF inflow trend noted this week could cushion the trend, although technical traders may view the rupture of the trend line as a reason to step back and reassess.
Risks to Watch
Hedera, like most mid-cap crypto assets, is sensitive to broader market conditions, and large fluctuations in Bitcoin or changes in overall risk appetite can easily override the technical settings described here. During periods of volatility, liquidity can also thin, making false breakthroughs and quick pins more common than usual. In addition, while ETF inflow data are encouraging, if the trend reverses or there is a broader retracement in institutional crypto asset allocations, it could have a negative impact on sentiment even if the chart pattern remains intact.
Glossary
Uptrend Line: A line drawn below a series of rising lows, used to identify support areas that tend to rise over time.
Retest: When prices return to levels that were previously broken or respected (such as trend lines) to check whether they are still effective as support or resistance.
Open Interest: The total number of derivative contracts (such as futures) that have not yet been settled, often used as an indicator of a trader's position.
Psychological price: Integer numbers (such as $0.10), traders usually pay close attention to them because of their perceived importance, even if there is no specific technical basis.
Disclaimer
This article is for reference only and should not be regarded as financial or investment advice. The cryptocurrency market is highly volatile and prices can fluctuate violently in either direction without warning. Before making any investment decisions, be sure to research and consult a qualified financial adviser.