Exchange Ranking
 Top Exchanges
 24h Volume Ranking
 Popularity Ranking
 Exchange BTC Balance
 Proof of Reserves
 Decentralized Exchanges
 Funding Rate
 Funding Heatmap
 Liquidation Data
 Max Pain
 Long/Short Ratio
 Whale L/S Ratio
 Binance/Okex/Huobi L/S
 Bitfinex Margin L/S
 ETF Tracker
 Solana ETF
 XRP ETF
 Hong Kong ETF
 Bitcoin Treasuries
 Crypto Reversal
 Ethereum Reserves
 HyperLiquid Wallet Analysis
 Hyperliquid Whale Watch
 Large Transactions
 On-chain Movement
 Bitcoin ROI
 Stablecoin Market Cap
 Options Analysis
 News
News Articles
 Economic Calendar
 Features
 Wallet
 Contract Calculator


 Security
 Collections
 Watchlist
 Following
The trading volume of on-chain RWA perpetual contracts reached US$123 billion in August, remaining above US$90 billion for four consecutive months.
In August, the trading volume of on-chain real-world asset (RWA) perpetual contracts reached US$123 billion, continuing the previous strong momentum of remaining above US$90 billion for four consecutive months. A record high of US$147 billion was hit in July, when RWA perpetual contracts briefly accounted for about 20% of the total transaction volume of perpetual contracts on the chain. Currently, open contract positions are close to US$4.9 billion, with TradeXYZ and Variational platforms controlling nearly 90% of reported positions.
RWA perpetual contract trading expanded rapidly, with monthly trading volume soaring from US$800 million to US$123 billion in ten months.
Monthly transaction volume accelerates in 2026
According to Wu Blockchain citing Castle Labs data, the market shows an exceptional growth trend. The platform reported that the transaction volume of the online RWA sustainable market exceeded US$120 billion in August, an increase of about 120 times compared with the base of less than US$1 billion in October. <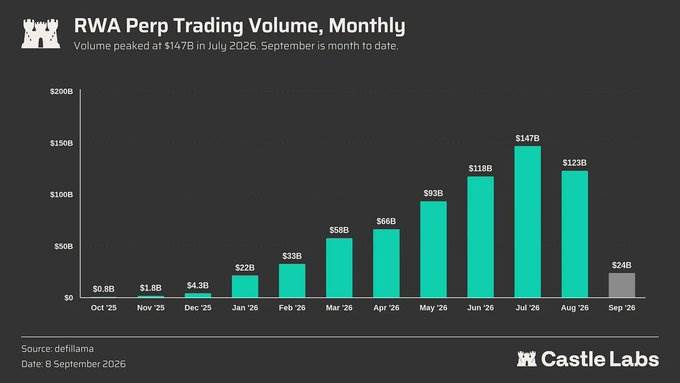 >
>
Chart data shows that the record in October 2025 was US$800 million. It then increased to $1.8 billion in November and climbed further to $4.3 billion in December. January saw a sharp increase, with monthly transaction volume reaching US$22 billion. Trading volume continued to climb to the chart's $33 billion in February, reaching $58 billion in March and $68 billion in April. By May, monthly activity rose again, reaching about $93 billion.
This accelerating trend continues into the summer months of the measurement cycle. Trading volume reached US$118 billion in June, making it the first month to exceed the US$100 billion mark. The peak in the chart was then established in July, at approximately $147 billion.
RWA perpetual contracts reach new trading size
Although trading volume in August fell back from the all-time high in July, it is still at a high level. The chart shows trading volume for the month at approximately US$123 billion, marking another full month to break the US$100 billion threshold. The current chart data for September shows US$24 billion, but this only covers a portion of the September data and cannot be compared to the complete monthly total. Therefore, July and August are still the latest complete monthly data that is comparable in the near future.
Wu Blockchain's report also pointed out changes in market share. In July, RWA perpetual contracts accounted for approximately 20% of the total transaction volume of perpetual contracts on the chain. In most months, its share reportedly remained between 12% and 13%.
These market share data provide background information on rising absolute trading volumes. This growth has been accompanied by increased participation in the broader perpetual contract market. As a result, while expanding its size, the sector also maintained a measurable share of derivatives activity across the chain.
Open open positions are still highly concentrated
Data provided show that the current open contract positions are close to US$4.9 billion. TradeXYZ and Variational reportedly accounted for nearly 90% of these open positions. This concentration contrasts sharply with the rapid expansion shown by monthly trading volumes.
The difference between trading volume and open positions provides another useful measure. Trading volume captures the trading activity completed during each period, while open positions reflect positions that are still active in the market.
The chart shows that growth has gone through several clear thresholds. Monthly trading volume first exceeded US$20 billion, then US$50 billion, and finally reached US$100 billion. After each phase, data readings were higher for subsequent full months.
For market observers, the strongest digital signal is the continued level of activity. From May to August, monthly transaction volume exceeded US$90 billion. Since September is not over yet, readings for the next full month will be the clearest indicator of continued momentum.