Exchange Ranking
 Top Exchanges
 24h Volume Ranking
 Popularity Ranking
 Exchange BTC Balance
 Proof of Reserves
 Decentralized Exchanges
 Funding Rate
 Funding Heatmap
 Liquidation Data
 Max Pain
 Long/Short Ratio
 Whale L/S Ratio
 Binance/Okex/Huobi L/S
 Bitfinex Margin L/S
 ETF Tracker
 Solana ETF
 XRP ETF
 Hong Kong ETF
 Bitcoin Treasuries
 Crypto Reversal
 Ethereum Reserves
 HyperLiquid Wallet Analysis
 Hyperliquid Whale Watch
 Large Transactions
 On-chain Movement
 Bitcoin ROI
 Stablecoin Market Cap
 Options Analysis
 News
News Articles
 Economic Calendar
 Features
 Wallet
 Contract Calculator


 Security
 Collections
 Watchlist
 Following
 XRP
XRP XRP prices are squeezed between two long-term moving averages, and historical data shows that this pattern has a worrying outcome.
XRP prices are being squeezed between two important long-term moving averages, forming a technical pattern. One analyst believes that based on historical data, this pattern often ends in poor results.
Analyst Vandel pointed to the weekly chart of XRP, where he believes the token is currently between the 50-week and 200-week moving averages. His concern is not only that XRP is consolidating, but also that in previous cycles, similar compression stages eventually ended when the lower boundary fell.
Currently, XRP is trading at about $1.35, down about 5% in the past seven days. Since its rebound in August, XRP prices have been difficult to establish a clear direction, and as the two long-term trend lines gradually converge, the market space has become narrower and narrower.
XRP is being squeezed between two long-term levels
The Binance weekly chart provided by Vandel clearly demonstrates this compression.
The orange moving average boundary aboveis currently around $1.62 and continues to trend downward. Meanwhile, the blue border below has climbed to about $1.24. XRP itself is priced at around $1.35-$1.39 on the chart, which puts prices closer to the lower half of the narrowed range.
Analysts cited two previous examples:
- After XRP peaked in 2018, the short-term moving average tilted downward, while the long-term moving average rose below prices. XRP was constantly compressed between the two, eventually losing its lower boundary and falling sharply.
- A similar structure appears after the 2021 cycle. XRP once again traded in the narrow space between the two moving averages until falling below the lower boundary during the 2022 bear market.
Therefore, Vandel believes that the current form is another potentially dangerous compression form.
However, there is an important limitation here: two previous examples alone are not enough to prove that the same result must occur again. The moving average is also a lagging indicator, and the final direction will be determined by price movements rather than the compressed pattern itself. <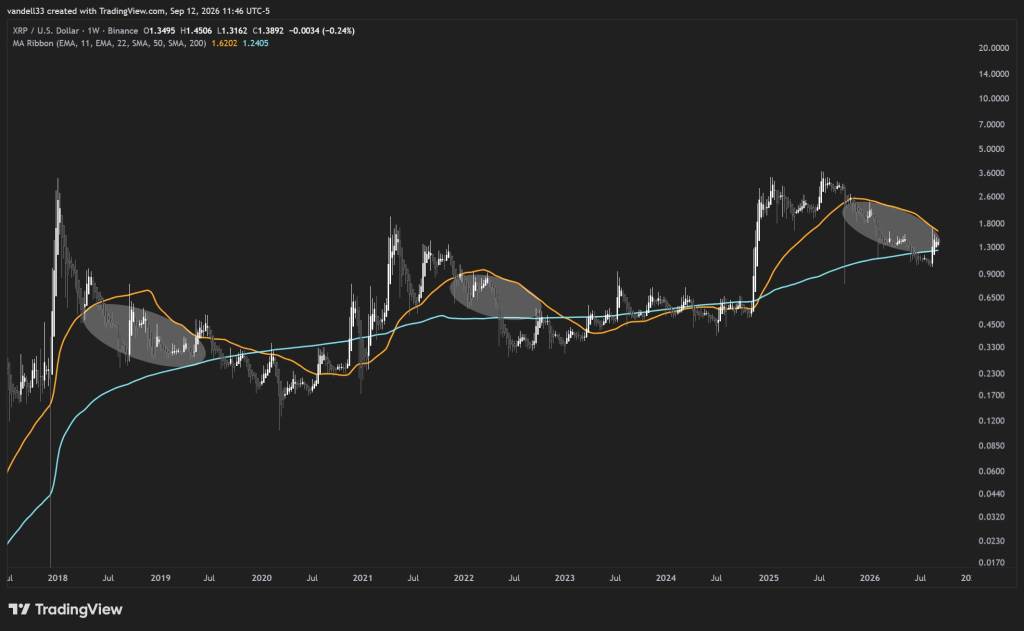 > Therefore, the statement that "history has always ended with a broken floor" should be seen as Vandel's interpretation of XRP's past cycles rather than an iron rule.
What happens if XRP loses support?
Recent price structures make the situation in the coming weeks particularly critical. XRP has been trading in the range of US$1.33 - 1.40 recently, and around US$1.30 has become an important short-term support level. The long-term moving average support in Vandel's chart is even lower at around $1.24.
This provides bulls with two layers of defensive ground:
- If XRP falls below $1.30, the possibility of moving into the $1.24 - 1.25 region will increase significantly. This will put the token directly on the rising long-term boundary that Vandel is concerned about.
- If he breaks below this area at the weekly level, his historical comparison of bearish losses will be more convincing. From then on, the psychologically (psychological) barrier of $1 may become relevant again.
But the chart is not completely bearish:
- The upper boundary of decline is about $1.62. If XRP can reverse the recovery of US$1.40 - 1.45, break through US$1.50, and eventually regain the US$1.60 - 1.62 area in the weekly timeframe, then the view that this compression must be resolved downward will begin to fail.
This would represent a very different result from the historical examples pointed out by Vandel.
XRP Price Outlook
For now, the chart calls for caution rather than assuming another major XRP crash is inevitable.
In the short term, US$1.30 - 1.33 is a key support area. Bulls need to hold on to the area and recover more than $1.40 before they can seriously challenge $1.45 - 1.50. Recent daily momentum readings were also broadly neutral and did not show a decisive trend.
The bigger game is reflected in Vandel's weekly chart:
- Around $1.24 represents the long-term bottom, while the downward boundary of around $1.62 represents the main top.
- As the two lines continue to move closer, the space XRP is trapped between them becomes smaller and smaller.
A break below $1.24 would give Vandel's bearish arguments more weight and could bring the dollar back into discussion. However, if prices regain their footing on the weekly line at around $1.60-$1.62 after recovering $1.50, it will completely reverse the current situation and may create a more favorable long-term outlook.
So far, XRP has not made any choice. Squeeze does exist, but the claim that it must end up falling below the bottom does not hold true.