Exchange Ranking
 Top Exchanges
 24h Volume Ranking
 Popularity Ranking
 Exchange BTC Balance
 Proof of Reserves
 Decentralized Exchanges
 Funding Rate
 Funding Heatmap
 Liquidation Data
 Max Pain
 Long/Short Ratio
 Whale L/S Ratio
 Binance/Okex/Huobi L/S
 Bitfinex Margin L/S
 ETF Tracker
 Solana ETF
 XRP ETF
 Hong Kong ETF
 Bitcoin Treasuries
 Crypto Reversal
 Ethereum Reserves
 HyperLiquid Wallet Analysis
 Hyperliquid Whale Watch
 Large Transactions
 On-chain Movement
 Bitcoin ROI
 Stablecoin Market Cap
 Options Analysis
 News
News Articles
 Economic Calendar
 Features
 Wallet
 Contract Calculator


 Security
 Collections
 Watchlist
 Following
 ETH
ETH Ethereum prices weaken, inflation data pushes up interest rate hike expectations
Core points:
- Ethereum prices fell 1.22% to US$2,487.51 at 4:40 (EST). The weekly line closed below $2,550, exposing the support level of $2,400.
- The consumer price index (CPI) rose 0.4% month-on-month in August, while the annualized inflation rate remained at 3.4%. The Chicago Mercantile Exchange's FedWatch tool showed that the probability of a September rate hike rose to 87%.
- The U.S. spot Ethereum ETF attracted $216.4 million in inflows on September 11, reversing a net outflow of $29.9 million the previous day.
- According to calculations by platform X analysts, as of September 13, Ethereum rose by 60.62% in the third quarter. Despite repeated resistance rejections, the weekly position of $2,550 remains the focus of the market.
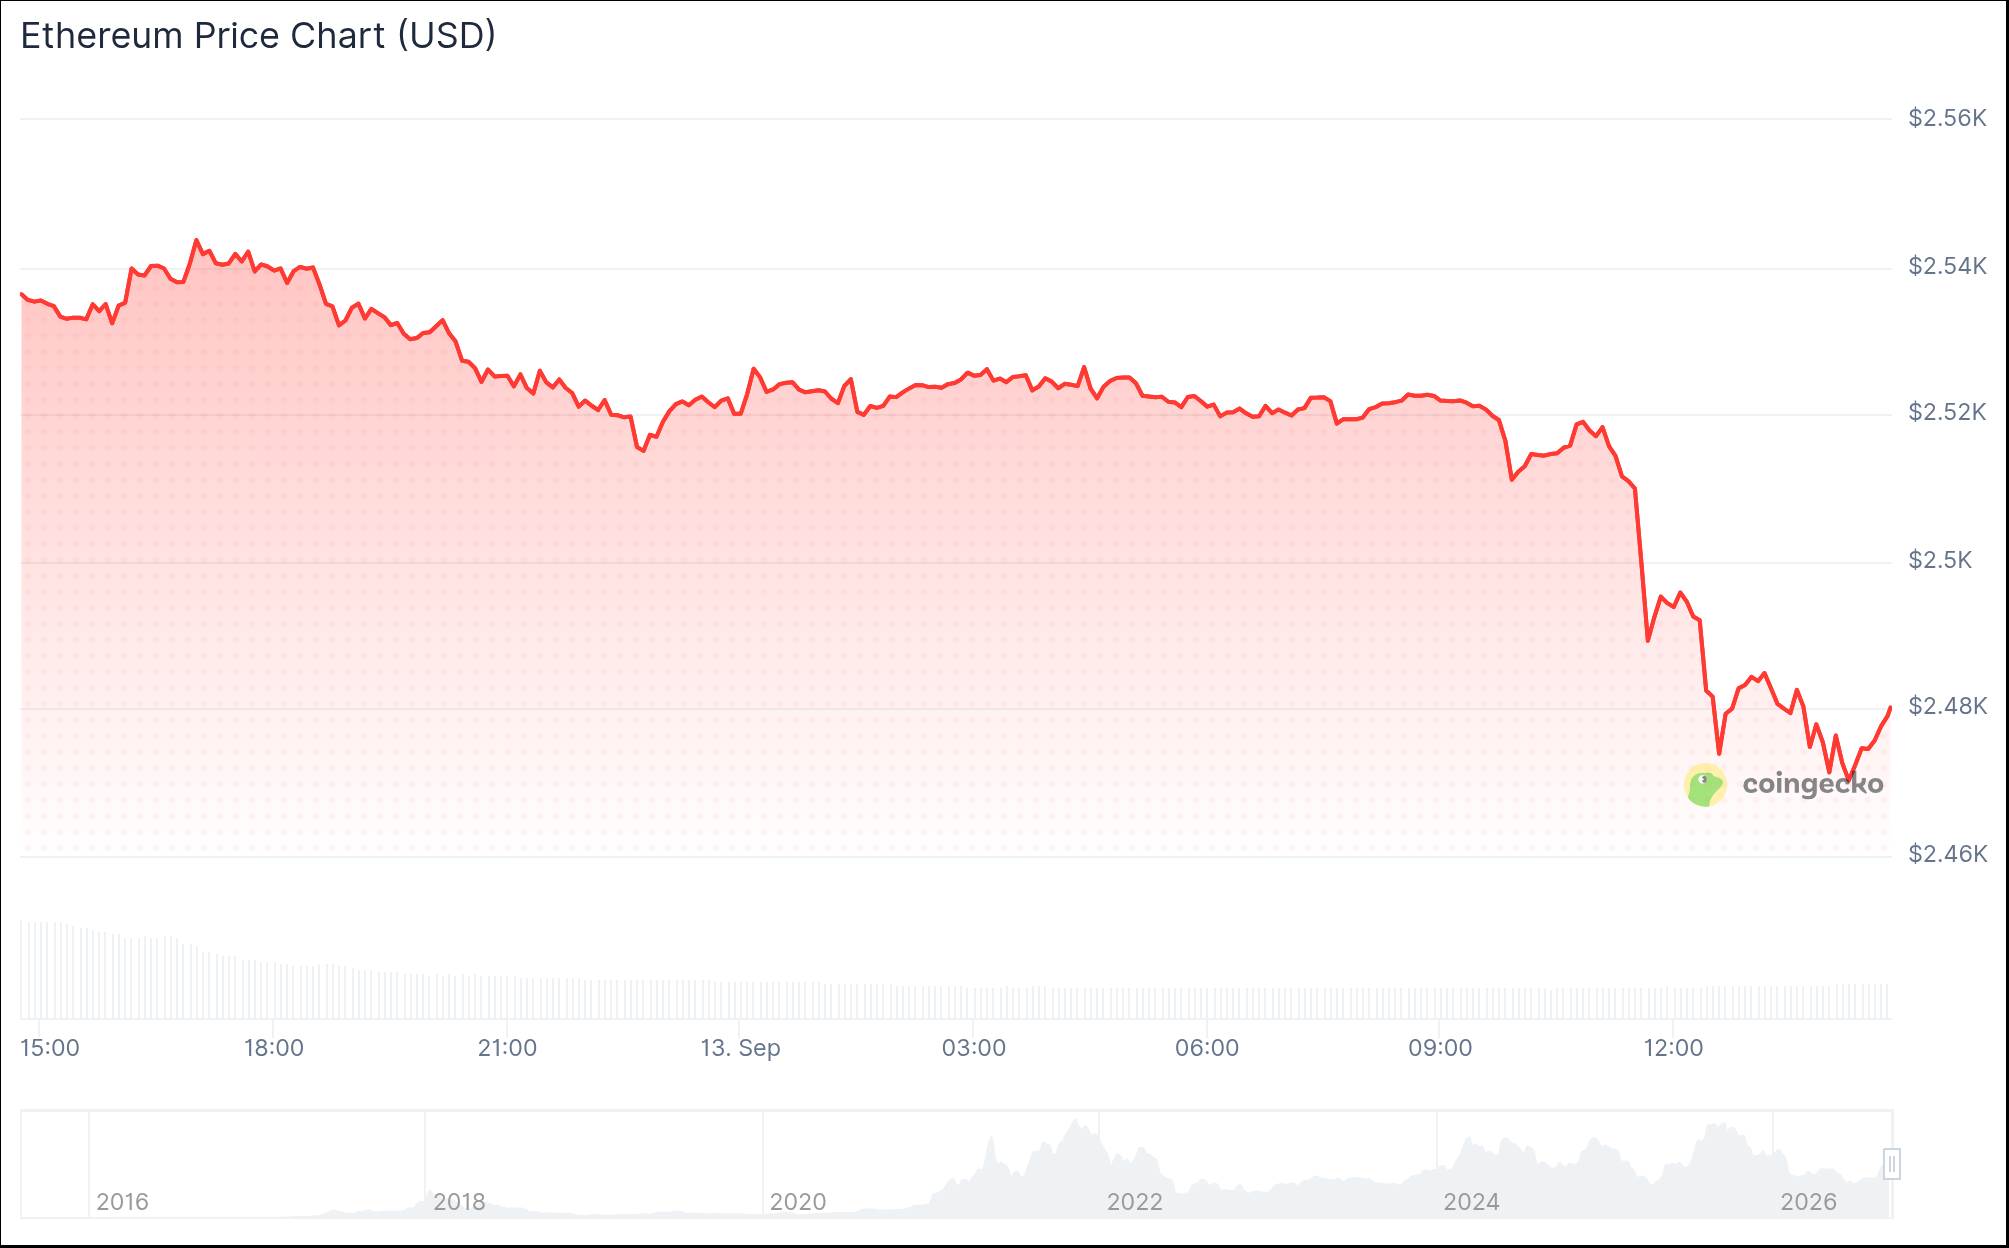
Ethereum (ETH) Price Analysis: Inflation intensifies Short-term weakness
Macro data partially explains the short-term weakness. Data from the U.S. Bureau of Labor Statistics showed that CPI rose 0.4% month-on-month and 3.4% year-on-year in August. Core CPI increased by 0.3% month-on-month, but the annualized core inflation rate fell to 2.4%. At the same time, the final demand producer price index rose 0.4% month-on-month and 5.4% year-on-year.
Interest rate futures markets responded quickly. After the CPI was released, CME FedWatch pricing showed an 87% probability of a 25 basis point rate hike in September, up from 72% the previous day. Stronger expectations of interest rate hikes have pushed up Treasury yields and increased funding costs in risky markets. In this context, Ethereum prices encountered selling pressure near key technical resistance levels.
Market conditions over the weekend posed another constraint. Outside normal institutional trading hours, the depth of cryptocurrency order books is usually shallow. Smaller trading volumes can cause large price fluctuations and trigger leveraged positions. A derivatives heat chart shows that cumulative long exposure below $2,405 exceeds $1.21 billion. This data estimates potential liquidation risks rather than completed losses or on-chain transfers.
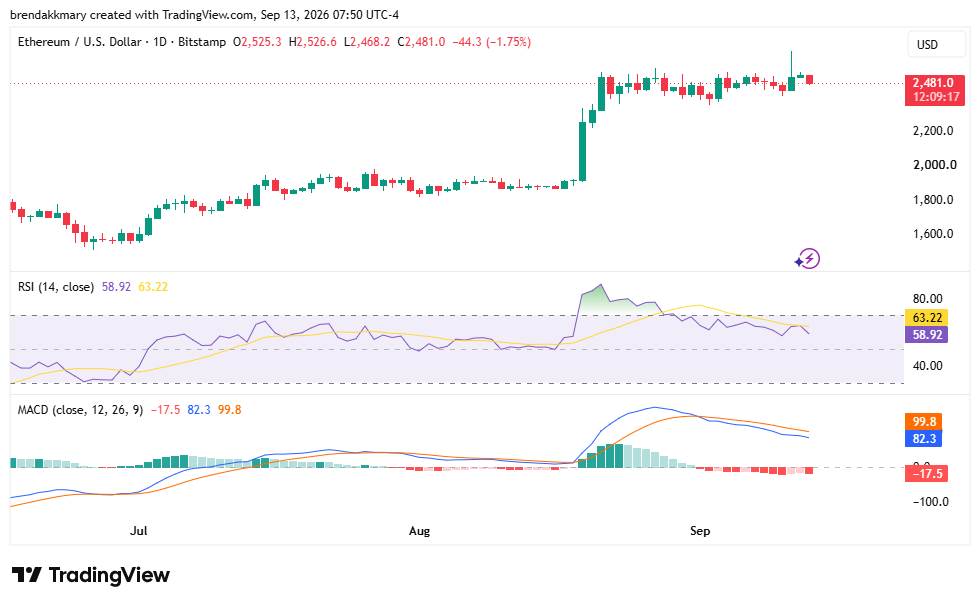
From the technical indicators, there is no decisive trend yet. The MACD indicator is in the negative sentiment range, with RSI of 58.92 and Williams %R of 54.027. The platform classifies these three readings as neutral signals as a whole. However, current price positions give greater weight to weekly closing prices.
analyst Ted Pillows pointed out that a weekly close below $2,550 could weaken Ethereum's prospects in the coming weeks. This threshold overlaps with the key 50-week moving average resistance level of approximately $2,542 - 2,550. If Ethereum fails to achieve a weekly close above $2,550, it could be bad for ETH in the coming weeks.
Ethereum must regain the area to reduce the risk of immediate rejection. If it fails,$2,405 and $2,400 will become nearby downside targets. A deeper break could accelerate the forced liquidation of positions on highly leveraged centralized exchanges.
ETF capital inflows and giant whale activity shape ETH prospects
The flow of funds provided hedging power for this correction. Farside Investors records showed that US spot Ethereum ETF inflows of US$216.4 million on September 11. This result reversed the outflow of $29.9 million on September 10 and increased total inflows from September 8 to 11 to $196.9 million. These data suggest uneven demand rather than continued withdrawal.
BlackRock's ETHA led the way on Friday with inflows of $148.8 million, followed by Bitwise's ETHW ($29.1 million). Fidelity's FETH increased by $11.4 million, and Grayscale's ETH fund attracted $5.1 million. Despite the re-adjustment of macro pricing, ETF inflows continue.
On-chain activities show a more divided situation. Lookonchain tracked a giant whale selling 167,855 ETH units worth $408 million in five days. After a large amount of supply was absorbed, Ethereum prices remained around $2,500. Previously reported withdrawals reduced the exchange balance by 116,000 ETH in early September.
Market sentiment is mixed, and resistance limits subsequent upward momentum. A platform X commentator calculated that as of September 13, ETH's increase in the third quarter of 2026 was 60.62%. This made it the second-best performing third quarter in history, behind the 66.55% increase in 2025. These results followed declines in both the first and second quarters.
Even so, historical performance does not guarantee price increases. Ethereum prices continue to fluctuate within ranges, with $2,500 serving as a key pivot in the near term. A weekly closing above $2,550 will improve ETH prospects and open up space to $3,000. Continued refusals will focus the market on $2,405.
Fund demand remained positive this week, but this did not eliminate immediate liquidation risks. At the price level of $2,487.51, Ethereum prices are between institutional capital inflows and pending weekly resistance tests.