Exchange Ranking
 Top Exchanges
 24h Volume Ranking
 Popularity Ranking
 Exchange BTC Balance
 Proof of Reserves
 Decentralized Exchanges
 Funding Rate
 Funding Heatmap
 Liquidation Data
 Max Pain
 Long/Short Ratio
 Whale L/S Ratio
 Binance/Okex/Huobi L/S
 Bitfinex Margin L/S
 ETF Tracker
 Solana ETF
 XRP ETF
 Hong Kong ETF
 Bitcoin Treasuries
 Crypto Reversal
 Ethereum Reserves
 HyperLiquid Wallet Analysis
 Hyperliquid Whale Watch
 Large Transactions
 On-chain Movement
 Bitcoin ROI
 Stablecoin Market Cap
 Options Analysis
 News
News Articles
 Economic Calendar
 Features
 Wallet
 Contract Calculator


 Security
 Collections
 Watchlist
 Following
 ADA
ADA Cardano 价格今日:实时数据
据 CoinGlass 数据显示,Cardano(ADA)当前交易价格为 0.2598 美元,过去 24 小时内上涨 3.67%。ADA 市值为 95.1 亿美元,未平仓合约金额为 6.1753 亿美元。过去 24 小时的期货交易量达到 10 亿美元,现货交易量为 2.2281 亿美元。流通供应量为 367.6 亿 ADA,总供应量为 449.9 亿 ADA,最大供应量上限为 450.0 亿 ADA。透明的供应时间表使得对 ADA 价格的预测讨论有了坚实的锚点。
来源:CoinGlass,2026 年 9 月 23 日
Cardano 今日新闻
真正的 Cardano 今日新闻隐藏在主导性数据中。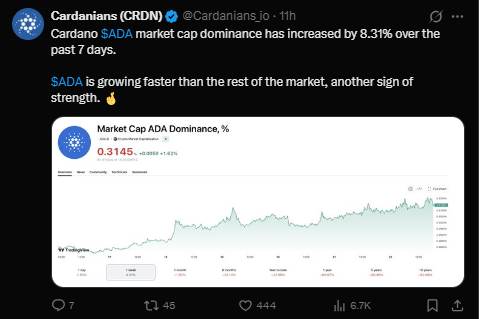 来自 X 平台 Cardanians 的一篇帖子指出,ADA 的市值主导性在过去七天内攀升了 8.31%,目前占总加密市场市值的 0.3145%,日内上涨 1.61%。对于任何进行 Cardano 趋势分析的人来说,这一框架至关重要:ADA 不仅仅是随市场波动,它正在夺取市场份额,技术分析师通常将此解读为在更大规模行情到来之前积累的早期信号。
来源:X 平台上的 Cardanians (@Cardanians_io),2026 年 9 月 23 日
快速摘要
当前市场价 (CMP): 0.2587(1 小时图,Binance ADA/USDT 永续合约)
触发位:收盘高于 0.2884 将目标指向 0.3134
失败位: 收盘低于 0.2408 将暴露 0.2183 的风险
数据时间戳: 2026 年 9 月 23 日
风险提示: 这些水平基于每小时收盘价;盘中刺穿任一区域并不确认突破
Cardano 价格预测技术分析
1 小时图表讲述了一个相当清晰的故事。ADA 在前几个交易时段沿着上升趋势线攀升,价格现已突破该结构,上行至 0.2587 至 0.2600 区间。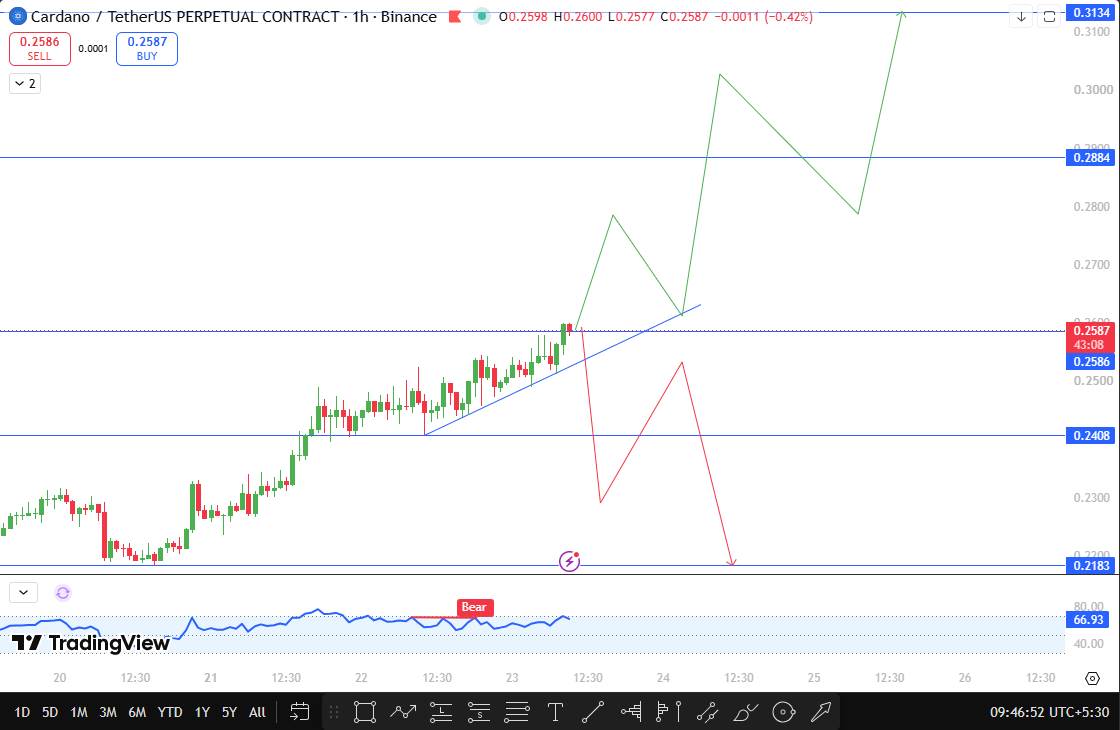 这次突破是在几根蜡烛图紧贴趋势线压缩之后发生的,这通常是预示方向性推动而非假突破的盘整形态。
引人注目的是,这一技术画面与 Cardanians 提供的主导性数据相吻合。当一枚硬币在自己的图表上突破结构,同时从其他币种手中夺取市值份额时,这种组合往往会吸引更多动量交易员的注意,一旦关键价位失守,可能会加速行情的推进。图表上在 23 日至 24 日中段出现的 RSI 风格看跌标签表明,在此次最新推动之前,动能曾短暂冷却,这符合健康的回测模式,而非耗尽的趋势。
来源:TradingView,2026 年 9 月 23 日
Cardano 支撑与阻力位
级别类型 价格 Percent distance from CMP Resistance 2 $0.3134 + 21.1% Resistance 1 $0.2884 + 11.5% Current price $0.2587 -Support 1 $0.2408 -6.9% Support 2 $0.2183 -15.6% Bullish, benchmark and bearish Cardano price outlook
Bullish situation: ADA holds the recovered trend line and gradually moves towards 0.2884. If this level is effectively exceeded, the goal of 0.3134 will soon be taken into consideration, given the continued strengthening of the dominant trend described by the Cardanians this week.
Benchmark scenario: ADA will fluctuate between 0.2408 and 0.2884 for a while, sorting out on the basis of recent gains and then choosing direction, which is a fairly normal pause after such gains.
A bearish situation: This is only possible when buyers lose the support platform of 0.2408. If this position falls, the next real demand area on the chart is 0.2183, so prices could quickly fall back into that area.
Risk to this Cardano price forecast
On lower time frame charts such as the 1-hour chart, momentum may fade quickly, so a breakthrough of 0.2884 requires continued volume to verify its validity. Broader crypto market sentiment, especially Bitcoin's dominant volatility, may override specific currency settings. A clearing chain reaction on both sides of 0.2408 or 0.2884 may result in sharp shadows that do not reflect the actual closing price.
Glossary
Dominance: Percentage of total crypto market capitalization held by a single currency.
Ascending Trendline: connects a series of rising support lines at higher lows.
Open Interest: The total value of outstanding derivative contracts.