Exchange Ranking
 Top Exchanges
 24h Volume Ranking
 Popularity Ranking
 Exchange BTC Balance
 Proof of Reserves
 Decentralized Exchanges
 Funding Rate
 Funding Heatmap
 Liquidation Data
 Max Pain
 Long/Short Ratio
 Whale L/S Ratio
 Binance/Okex/Huobi L/S
 Bitfinex Margin L/S
 ETF Tracker
 Solana ETF
 XRP ETF
 Hong Kong ETF
 Bitcoin Treasuries
 Crypto Reversal
 Ethereum Reserves
 HyperLiquid Wallet Analysis
 Hyperliquid Whale Watch
 Large Transactions
 On-chain Movement
 Bitcoin ROI
 Stablecoin Market Cap
 Options Analysis
 News
 Articles
 Economic Calendar
 Features
 Wallet
 Contract Calculator


 Security
 Collections
 Watchlist
 Following
 BTC
 PEPE
Pepe plunged 11.7% in a single day, and giant whale holdings were highly concentrated.
Pepe fell 11.7% in one day, and only 665 giant whale wallets accounted for about 90% of its market value. This sharp decline and highly concentrated position structure form the background for this Pepe price forecast and the broader Pepe outlook for September 2026.
PEPE will be launched in April 2023 as an Ethereum-based meme token, inspired by the character of "Pepe the Frog" created by cartoon artist Matt Furie. Pepe Coin has a fixed supply of 420.69 trillion coins and currently ranks 54th in market value.
Today's Pepe price was $0.00000441, down 11.7% in 24 hours and 9.0% against Bitcoin. The 24-hour trading range is $0.0000429 to $0.0000503. Trading volume reached US$549.2 million, with a market value of US$1.859 billion.
Real-time PEPE Market Data
Indicator Value Price $0.0000441 24-hour change-11.7% 24-hour range $0.0000004298-$0.00005037 Market Value $1.859B Data source: CoinGecko market data, as of September 24, 2026. Data from other tracking sites may differ slightly.
Position concentration and today's Pepe news
In the data reviewed, no single news headline could explain the price decline. The clearest Pepe news this week is reflected in position data.
For those following today's Pepe news, the core point is concentration. The top 5 holders own 26.13% of the market value, the top 10 holders own 35.65%, and the top 100 holders own 76.86%. There are 20 holders each controlling at least 1% of the total supply of $PEPE.
Level holders number of holders as a percentage of market value Whale 6650.11% 90.02% Shark 3,2980.56% 4.84% Dolphin 21, 3823.61% 3.38% Fish 79,84313.48% 1.38% Crab 163,79027.66% 0.34% Shrimp 323,15554.57% 0.03% Data source: Etherscan data, as of September 24, 2026
These 665 giant whale wallets are consistent with the number of wallets each holding more than US$100,000. Another 162 wallets hold more than $1 million. The Gini coefficient is 0.9938, very close to the maximum inequality value of 1. The total number of tracked wallets across levels is approximately 592,000, of which more than half are "shrimp" retail investors with almost no weight.
Concentration is a double-edged sword. A few large wallets can buy to support prices and increase huge selling pressure. The data shows the distribution of supply, but does not show the planned movements of these wallets.
Pepe Price Forecast: 1-Hour Technical Analysis
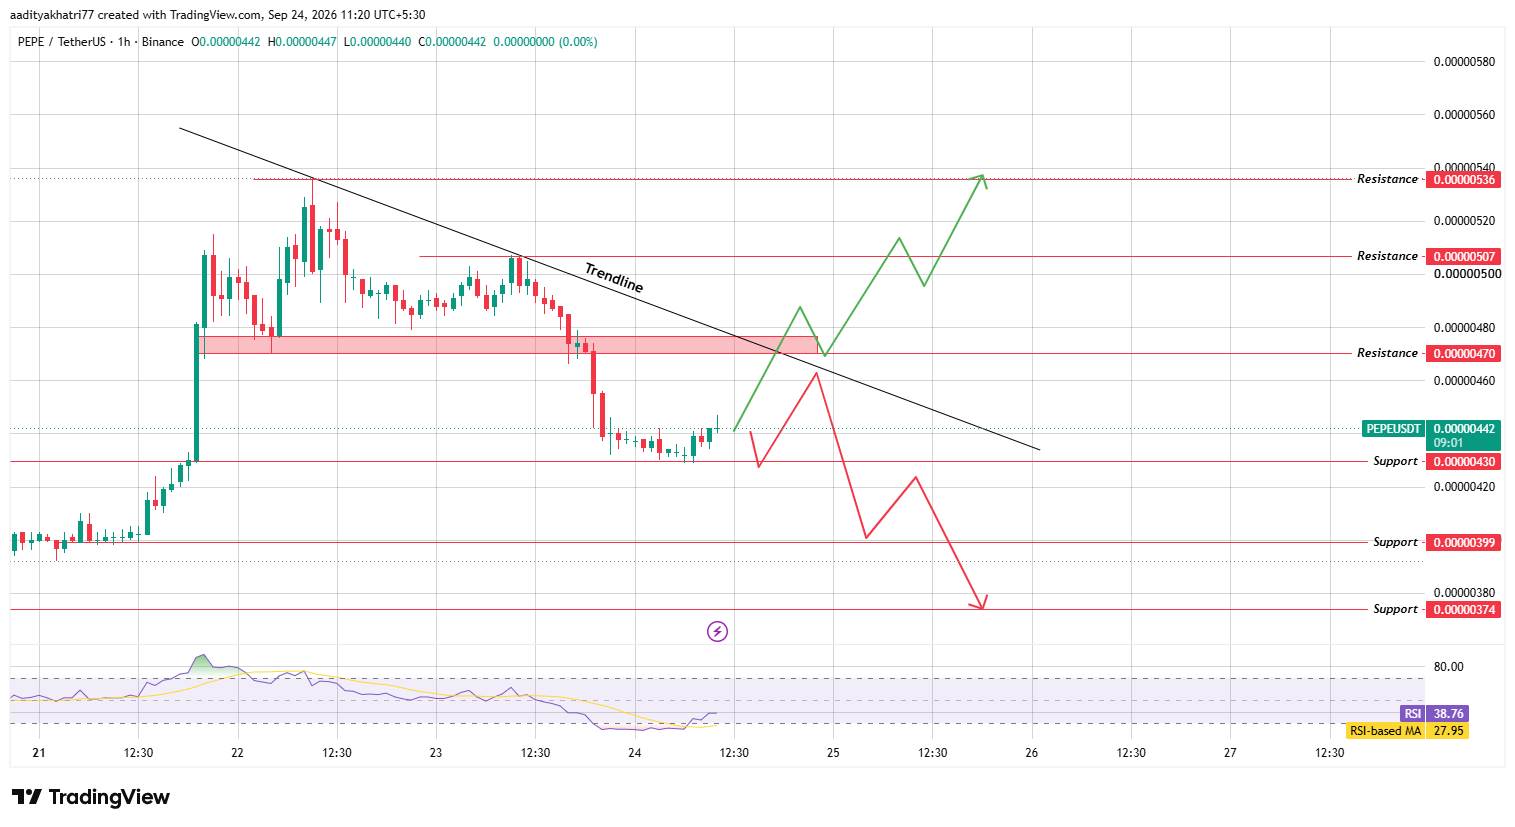
This Pepe Technical Analysis uses the Binance Platform PEPE/USDT 1-Hour Chart collected at 11:20 Indian Standard Time (IST UTC+5:30) on September 24, 2026.
PEPE rose from approximately $0.0000400 to $0000536 on September 21 and 22. A downtrend line then formed from this high point.
 Source: Chart taken from TradingView, as of September 24, 2026
September 23, prices fell below the support zone of nearly $0.0000470, which has now transformed into resistance.
Prices are below the downtrend line and are testing the support level of $0.0000430.
The Relative Strength Index (RSI) read at 38.76, still below the 50-axis but above its moving average of 27.95. Selling pressure eased, but momentum remained weak.
Average daily trading volume of US$549.2 million, or approximately 29.5% of market value, suggests that the decline was accompanied by active trading. Even after this decline, PEPE prices are still about 84% below their December 2024 high of nearly $0.00028.
Can PEPE break through the trend line and go higher?
Bullish arguments require prices to rebound at $0.0000430 and then break through the downtrend line.
The trend line is close to the resistance level of $0.0000470 in subsequent trading, so these two obstacles are concentrated in the same area. A breakthrough of $0.00000470 means an increase of approximately 6.3% over chart prices.
If the 1-hour K-line entity closes higher than both, and the trading volume is at least 1.5 times the average of the top 20 K-lines, the trend is confirmed. Leaving only the lower shadow line to cross the trend line is not an effective breakthrough. Only in this case can a PEPE bullish structure be formed, that is, low points rise and high points rise. The current structure remains bearish as lower and higher highs still define the current trend.
The first Pepe price target is $0.0000507, which is about 14.7% higher, which was the price rejected on September 23.
The second target price is $0.0000536, which is about 21.3% higher, the September 22 high.
The chart shows that the trend line may be retested before the second wave, which will be a normal pullback.
What happens if PEPE is rejected at the trend line?
A bearish argument starts when it is rejected at the trend line or $0.0000470 area. The price will then fall back to $0.0000430.
If the 1-hour K-line physical closing price falls below this support level, the next downward trend will be opened.
The next downside level is $0.0000399, which is about 9.7% lower than the chart price. Below it is $0.00000374, which is about 15.4% lower.
The chart marks small rallies in the process, so the decline may not proceed in a straight line. Traders should first observe the reaction at the trend line.
Today's Pepe price level
The following table lists Pepe price levels from the 1-hour chart. The first Pepe price level to pay attention to today is $0.0000430 at the bottom and $0.0000470 at the top.
Support and Resistance
Support Resistance (Resistance)$0.0000430$0.0000470 $0.000399$0.0000507 $0.0000374$0.0000536 Pepe Coin bull market, Benchmark and Bear Market Scenarios
Scenarios Set Conditions Target price Bull Market (Bull)1-hour K-line entities closed at the downtrend line and above $0.0000470 at $0.0000507 with strong trading volume, Then there is $0.0000536 Base price holding at $0.000430 but remaining below the trend line at $0.0000430 to $0.0000470 Bear market 1 hour closing below $0.0000430 $0.0000399, Then there was $0.00000374 Pepe vs Bitcoin
PEPE, down 11.7% in U.S. dollar terms and 9.0% against Bitcoin. These data suggest that Bitcoin lost about 3% during the same period. Much of the decline was attributed to PEPE itself.
Meme tokens tend to be more volatile than Bitcoin. Stable Bitcoin helps any trend that breaks through the trend line, while new Bitcoin weakness increases the risk of falling below $0.0000430. Readers building Pepe price forecasts should focus on both charts.
Expert Opinion
关于PEPE的一般市场评论集中在两点上。交易者通常将跌破的支持区转化为阻力区视为弱势信号,直到价格重新收回该区域。
持仓集中度增加了第二重风险,因为一小部分钱包可以快速改变供应量。
任何Pepe价格预测都应配合固定的退出计划。PEPE在一天内下跌了11.7%,且各水平之间的差距可能很大。