Exchange Ranking
 Top Exchanges
 24h Volume Ranking
 Popularity Ranking
 Exchange BTC Balance
 Proof of Reserves
 Decentralized Exchanges
 Funding Rate
 Funding Heatmap
 Liquidation Data
 Max Pain
 Long/Short Ratio
 Whale L/S Ratio
 Binance/Okex/Huobi L/S
 Bitfinex Margin L/S
 ETF Tracker
 Solana ETF
 XRP ETF
 Hong Kong ETF
 Bitcoin Treasuries
 Crypto Reversal
 Ethereum Reserves
 HyperLiquid Wallet Analysis
 Hyperliquid Whale Watch
 Large Transactions
 On-chain Movement
 Bitcoin ROI
 Stablecoin Market Cap
 Options Analysis
 News
 Articles
 Economic Calendar
 Features
 Wallet
 Contract Calculator


 Security
 Collections
 Watchlist
 Following
 BTC
 DOGE
 ETH
 LINK
 SHIB
 SOL
 XRP
Bitcoin waits for Wednesday's CPI data: Current volatility is extremely low, key points and operational recommendations
On Saturday afternoon, the price of Bitcoin was US$82,749 (approximately 73,863 euros). In the past 24 hours, prices have changed by only 0.2%; across the week, prices have fallen 2.1%. Compared with the violent fluctuations in previous days, the current market trend is almost stagnant. This kind of "stagnation" is the main theme of the market today, as the U.S. consumer price index (CPI) is released on Wednesday, a data that is likely to determine the direction of the market in the coming weeks.
1. Current situation of the market: extremely narrow trading range
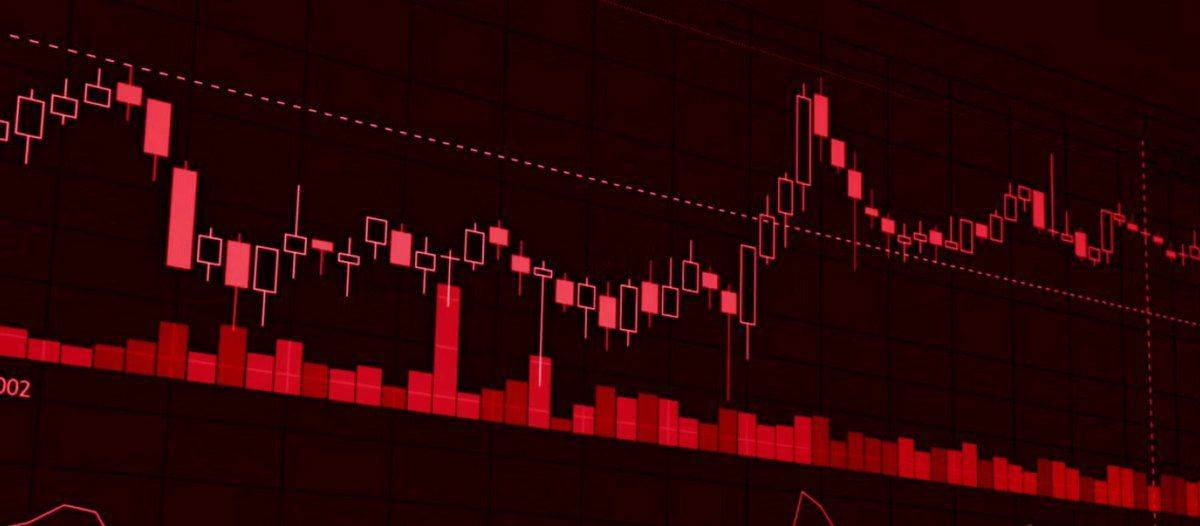
Looking at today's Bitcoin chart, it seems calm; but if you look at the trading range, you can find the pattern revealed by specific data: The gap between the highest and lowest prices within the day has narrowed to less than one-third of the weekly average. This article will explain how to identify key prices from the current calm, what will happen at 2:30 pm German time on Wednesday, and three key numbers investors should identify in their portfolios beforehand.
Bitcoin price data on Saturday afternoon:
Prices have fluctuated within a narrow range since morning. The 24-hour high price was US$83,204 and the low price was US$82,229, a difference of US$975 (or 1.2%). For comparison: Thursday's high-low spread was $3,136. Converted to euros, the price of Bitcoin is approximately 73,863 euros. The data source is CoinGecko, and the statistical time is Saturday afternoon, October 10. Background information: The current price is still about 34% short of its historical record of $126,080.
定义说明:
为了便于理解下文,在此简要定义“日内区间”(Daily Range):它指一天内最高价与最低价之间的距离,以占当日最低价的百分比表示。该指标衡量的是市场在某一日内的波动幅度,无论最终收盘价如何。例如,某天收盘价可能持平(涨跌幅为0%),但日内区间仍可达4%。
二、 本周最窄区间:仅0.74%
本文评估了CoinGecko过去两周的四小时K线数据,并据此确定了每个日历日的最高价和最低价。过去七天的日内区间百分比如下:
- 10月4日(周日):1.12%
- 10月5日(周一):2.28%
- 10月6日(周二):1.79%
- 10月7日(周三):3.42%
- 10月8日(周四):3.90%
- 10月9日(周五):2.24%
- 10月10日(周六,截至午后):0.74%
此前六天的平均值约为2.46%。而目前的周六数值仅为0.74%,不到周平均水平的30%。由于当天尚未结束,区间仍有扩大可能。即使到午夜翻倍,仍将低于周平均水平。值得注意的是,周六的走势通常比工作日平静,因为美国交易所休市,ETF计数器静止,机构订单暂停。然而,今日的波动幅度之小依然引人注目:上周六(10月3日)的区间为0.93%,随后的周日为1.12%。因此,即便对于周六而言,今天也显得异常狭窄。
三、 自周五以来的变化
我们在周五的文章中曾讨论过比特币价格与油价的关系。当时比特币价格为82,991美元,布伦特原油跌至103.53美元,市场关注点在于油价回落是否能缓解加密货币市场的压力。此后,价格几乎未变:今日82,749美元与周五午后的82,991美元相比,差异仅为242美元(0.3%)。真正发生变化的是“波动性”本身。周五日内波动幅度为2.24%,而今日仅为0.74%。周四晚间短暂跌破的82,000美元关口,自周五早盘以来未曾触及。因此,周四低点80,427美元已连续两天保持为本周最低点。
For readers who continue to follow this series, the core issue has shifted. The question last week was "Will the decline continue", which has now been provisionally answered: the decline has not continued. The question now turns to: "In which direction will the market break through from this calm?" and "What drove this breakthrough?"
4. Why the narrow range before the data release is not a safety cushion
The mechanism behind it is not mysterious and can be explained in three steps:
- Position expansion: When prices hardly fluctuate for a few hours, the measured volatility drops, and the trading company's risk model will be adjusted accordingly. Lower measured volatility allows the model to build larger positions under the same risk budget. As a result, positions tend to get bigger rather than smaller.
- Aggregation of stop loss and clearing thresholds: In the futures market, stop loss orders and clearing thresholds gather tightly during these stages. Many participants will set levels at the same visible point, such as intraday highs, intraday lows, or integer levels. The narrower the range, the closer these points are.
- Chain reaction: These thresholds are quickly triggered when news forces the market to choose direction. Each triggered clearing produces a market order that moves prices further in the same direction, reaching the next threshold. This forms a chain reaction (Cascade).
这种情况在实践中已有先例。本周四的分析显示,Dogecoin有94%的清算针对多头头寸(即押注价格上涨)。当日比特币从83,563美元跌至80,427美元。触发因素并非灾难,而是油价链条及市场对美联储预期的克制。这证明了窄幅区间后往往伴随剧烈的方向性运动。
五、 周三CPI数据详解
周三,美国劳工统计局将公布9月份消费者价格指数(CPI)。发布时间为美东时间上午8:30,即德国时间下午2:30。CPI衡量一篮子固定商品和服务的价格相对于一年前同一月份的涨幅。它是市场利率预期的最重要单一指标。
为何这对比特币至关重要:
市场预期美联储是否降息以及降息幅度的变化,会推动美元走势及所有市场的风险偏好。通胀上升意味着降息可能性降低,而在过去两年中,降息落空曾多次对加密资产价格造成压制。这种联系虽非机械性的,但自2022年以来已足够稳定,使得交易台据此进行定位。
本周三的特殊性:
First, according to analyst forecasts cited by Admiral Markets, annual inflation is expected to rise from 3.4% to between 3.6% and 3.7% driven by gasoline prices in September. Secondly, this is the last inflation data release before the Federal Reserve's October 28 interest rate decision. If the reading is significantly higher than expected, there will be no opportunity for the market to recalibrate its position before the interest rate decision.
6. Bitcoin outperforms altcoins: Weekly balance analysis
In addition to the chart perspective, comparisons within the market provide a second perspective. Over the past seven days, the performance of major currencies is as follows:
- Bitcoin: -2.1%
- Shiba Inu: -4.1%
- XRP: -5.4%
- Ethereum: -7.0%
- Chainlink: -7.1%
- Dogecoin: -7.6%
- Solana: -8.1%
Bitcoin suffered a decline of about a quarter of Solana and a third of Dogecoin. This is a familiar pattern during the phase of market withdrawal from risky assets: Smaller market capitalization currencies fall more sharply because their order books are thin and investors tend to sell the most leveraged assets first. Therefore, Bitcoin's current narrow range is not a signal of general calm in the market, but rather a sign that Bitcoin is the most stable part of the current overall stressed market.
VII. Analysis of key points
Upper resistance level:
- $83,204: 24-hour high, which is also the boundary of the current range. Breaking through this level will be the first signal of a calm end and an upward breakthrough.
- $84,150 - $84,260: Analytics service DiarioBitcoin points to this range for the next resistance. While prices are currently below the past 7, 15 and 20-day moving averages, they are still above the 30, 50, 90 and 200-day moving averages. Trading volume in this region is lower than the 30-day average, which is consistent with the characteristics of a narrow range. From the current level to this upper edge region, it needs to rise by about 1.7%, which is a range the market has achieved many times during normal trading days.
Lower support:
- $82,229: 24-hour low, about 0.6% below current prices, marking the lower edge of the calm zone.
- $80,427: Weekly low late Thursday, about 2.8% below current levels. Its uniqueness lies not in the value itself, but in the meaning it represents: the last time the price fell below this point was in early September. A break below this level will not only repeat Thursday's decline, but may also extend it.
In addition, analytics service Börse Global considers the integer mark of $83,000 as a short-term decision level and focuses on the area around $80,000. Both assessments point in the same direction: within the framework of about $80,000 to $84,000, the course of the next few days will be decided. [TAG
VIII. Leverage and liquidation: three numbers that must be clear by Wednesday
When the interval is narrow and there is data to be released soon, the obvious action is not to guess the direction, but to know your key data in advance. The following are three calculable numbers:
- Liquidation Price: Those holding leveraged positions can view this price on the exchange. The key is its percentage distance from the current price. If the distance is less than 3%, it is within the range of single-day fluctuations this Wednesday or last Thursday. Leveraging users should also be aware of the platform's Funding Rate and settlement mechanism, as they will change the clearing price during the period of holding a position.
- Holding Period: In Germany, gains from selling cryptocurrencies for more than one year are exempt from tax; an exemption of 1,000 euros per year applies for one year. Investors holding balances close to the year-end deadline should have a clear understanding of when to buy each segment of their positions before responding to panic on Wednesday.
- Buying Route: If you plan to add to your position while testing the $80,427 low, you need to plan your path in advance rather than decide it at the moment of action. Verification on new exchanges takes hours to days, and bank transfers may require overnight. Investors should learn in advance about the authorized providers under German MiCA regulations and their costs per order.
IX. Comprehensive Assessment and Conclusions
The editorial team believes that the narrow range is the most significant signal this weekend, signaling tensions rather than relaxation. Evidence includes: the 0.74% range is well below the weekly average of 2.46%, trading volume is below the 30-day average, and the market is facing Wednesday's CPI data-the last inflation report before the October 28 interest rate decision.
However, this signal should not be over-interpreted. Quiet Saturdays are first Saturday, and there was no extraordinary weekly market after the 0.93% range last Saturday. The direction in which the market goes out from the narrow range stage cannot be deduced solely from the narrow range itself; the narrow range can only indicate the strength of the potential movement, not the positive and negative direction.
Therefore, the conclusion drawn is not a directional bet, but the necessity of preparation. The areas around $82,229 and $80,427 below, and the areas around $83,204 and $84,150 above, will be key points for the market to demonstrate its intentions on Wednesday.
Summary action steps:
- Recalculate thresholds: Note the clearing price and its percentage distance from the market. If the distance is less than 3%, it is within the normal intraday fluctuation range this week.
- Pre-determine the buying path: Fix the verification process, payment method, and order fees before testing key points.
- Tagged: Wednesday, October 14, 2:30 pm German time. If there are pending orders at that time, you need to know that the spread will usually widen in the next few minutes. If you prefer to track trends through exchange-traded products, please check out the overview of Germany's tradable crypto ETPs and ETPs in advance.
(As of October 10, 2026. This article does not constitute investment advice. Price and fee structures are subject to change; please check terms with your provider before purchasing.)