Exchange Ranking
 Top Exchanges
 24h Volume Ranking
 Popularity Ranking
 Exchange BTC Balance
 Proof of Reserves
 Decentralized Exchanges
 Funding Rate
 Funding Heatmap
 Liquidation Data
 Max Pain
 Long/Short Ratio
 Whale L/S Ratio
 Binance/Okex/Huobi L/S
 Bitfinex Margin L/S
 ETF Tracker
 Solana ETF
 XRP ETF
 Hong Kong ETF
 Bitcoin Treasuries
 Crypto Reversal
 Ethereum Reserves
 HyperLiquid Wallet Analysis
 Hyperliquid Whale Watch
 Large Transactions
 On-chain Movement
 Bitcoin ROI
 Stablecoin Market Cap
 Options Analysis
 News
News Articles
 Economic Calendar
 Features
 Wallet
 Contract Calculator


 Security
 Collections
 Watchlist
 Following
 BTC
BTC  ETH
ETH Institutional demand is returning to Bitcoin and Ethereum, but prices alone may be hard to detect.
U.S. spot Bitcoin and Ethereum ETFs together attracted approximately US$1.1 billion in net inflows during their first full trading week in August. Although institutional demand appears to be picking up, Bitcoin is still hovering below $65,000, while Ethereum is struggling to break the $1,900 barrier.
This divergence raises a key question: If institutions are buying again, why are cryptocurrency prices so little or no?
Bitcoin and Ethereum ETFs record a strong week
According to the latest data from Farside Investors, between August 3 and August 7, net inflows into U.S. spot Bitcoin ETFs were approximately US$865 million. Some previous estimates set the weekly data at approximately US$853.5 million due to differences in reporting time and revisions to later data. Either figure marks a significant reversal of capital outflows from the previous week.
The most eye-catching thing is its persistence. Bitcoin ETF recorded positive net inflows on all five trading days:
August 3:$170.1 million
August 4:$211.5 million
August 5:$244.4 million
August 6:$137.6 million
August 7: US$101.7 million
BlackRock's IBIT accounts for approximately US$693.5 million of the weekly total and approximately 80% of all Bitcoin ETF inflows.
The Ethereum ETF also had one of its strongest weeks in months. Farside's Ethereum ETF data showed that despite a small outflow at the beginning of the week, net inflows still reached about $244 million.
Taken together, Bitcoin and Ethereum ETFs attracted more than US$1.1 billion in funding.
Why did Bitcoin and Ethereum respond so little?
The first explanation is the issue of scale. Bitcoin's current market value is approximately US$1.3 trillion. Although US$865 million is a considerable amount of institutional capital, it is still small compared to Bitcoin's total valuation and global daily trading volume.
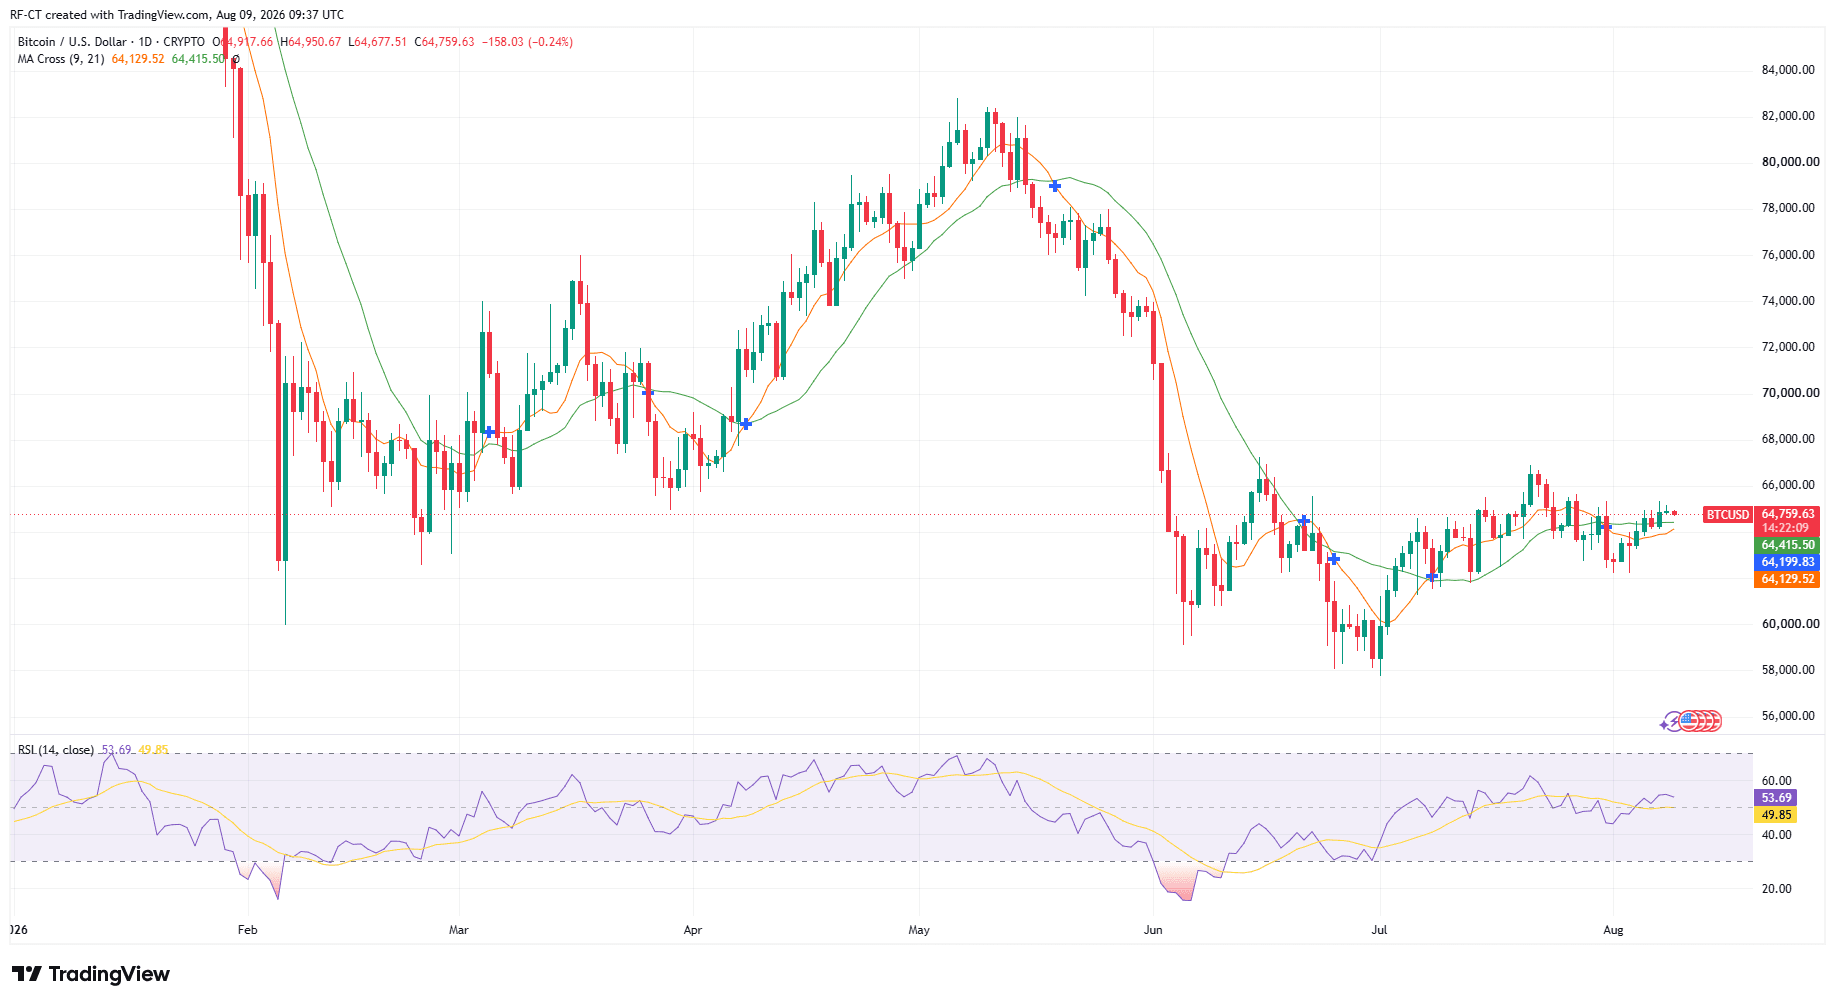
ETF demand represents only part of the market. Selling on centralized exchanges, over-the-counter platforms and derivatives markets can offset buying pressure from ETF inflows. In other words, ETFs may be buying, but other investors are still selling.
This may explain why Bitcoin has been trapped in the US$64,000 to US$65,000 range rather than immediately breaking through the upside. Inflows may be supporting prices and preventing a deeper correction, but they are not yet large enough to overcome selling pressure near resistance levels.
Ethereum responded slightly better. ETH climbed to about $1,914 from about $1,845 at the beginning of the week, but has not yet decisively exceeded the $1,920 resistance zone or challenged the psychological level of $2,000.
ETF inflows do not always mean an immediate increase in prices
Another factor is how institutional investors use ETFs. Not every ETF purchase represents a simple bullish bet on rising cryptocurrency prices. Some professional investors use ETF shares as part of hedging positions, arbitrage strategies, or long-term asset allocation.
This means that when ETF inflows increase, they will not create the same immediate price pressure as investors directly buy spot from exchanges. Institutional accumulation also tends to be less emotional than retail activity. Instead of chasing sudden breakthroughs, large investors can build positions gradually over a few weeks.
Therefore, recent capital inflows may be an early signal rather than an immediate price catalyst.
Is this silent accumulation or a warning signal?
The optimistic explanation is that institutions are quietly accumulating Bitcoin and Ethereum when prices are relatively low. Five consecutive trading days of Bitcoin ETF inflows suggest that demand is not based on a single large transaction. The concentration of funds in Bitcoin and Ethereum also shows that institutional investors still favor the two largest cryptocurrencies over the more speculative altcoins.
If this inflow continues, existing selling pressure may eventually weaken, pushing prices higher.
However, there are also more cautious interpretations. If ETF inflows of more than $1.1 billion cannot push Bitcoin above $65,000 or Ethereum to $2,000, the market may face stronger upside selling pressure than the superficial numbers suggest. In this case, ETF demand is absorbed by sellers rather than contributing to a real breakthrough.
What happens next?
For Bitcoin, the $65,000 to $66,000 area remains an immediate test. Continued breakthroughs in this area, supported by another week of positive ETF inflows, will show that institutional demand is finally beginning to affect the overall market. If it cannot break through, Bitcoin may continue to be trapped in the current range. Losing the $64,000 area will weaken the view that ETF demand provides reliable support.
Ethereum must first stand firm at about $1,920. A successful breakthrough could open the way to US$2,000, while a blockage would make ETH vulnerable to the testing US$1,880 to 1,860 area.
Regardless, the US$1.1 billion ETF week is undoubtedly positive, but has yet to produce a confirmed market breakthrough. For now, institutional demand seems to be supporting cryptocurrency prices rather than driving them up.