Exchange Ranking
 Top Exchanges
 24h Volume Ranking
 Popularity Ranking
 Exchange BTC Balance
 Proof of Reserves
 Decentralized Exchanges
 Funding Rate
 Funding Heatmap
 Liquidation Data
 Max Pain
 Long/Short Ratio
 Whale L/S Ratio
 Binance/Okex/Huobi L/S
 Bitfinex Margin L/S
 ETF Tracker
 Solana ETF
 XRP ETF
 Hong Kong ETF
 Bitcoin Treasuries
 Crypto Reversal
 Ethereum Reserves
 HyperLiquid Wallet Analysis
 Hyperliquid Whale Watch
 Large Transactions
 On-chain Movement
 Bitcoin ROI
 Stablecoin Market Cap
 Options Analysis
 News
News Articles
 Economic Calendar
 Features
 Wallet
 Contract Calculator


 Security
 Collections
 Watchlist
 Following
 ETH
ETH Ethereum price forecast is close to the key breakthrough range
ETF outflows coexist with BitMine accumulation and macro pressure
Ethereum price forecast depends on whether the daily closing price can break through the range of US$1,918 to US$1,920. If it can break through, it may open up upside space for US$1,960 and US$2,000.
The spot Ethereum ETF recorded a net outflow of $2.26 million last week after five consecutive weeks of net inflows (cumulative $566.12 million).
Net traffic on the Ethereum Exchange was negative US$3.48 million, while open interest fell, indicating that traders are reducing directional exposure.
BitMine holds 5.81 million ETH units, accounting for 4.8% of total supply, while Tom Lee maintains his target price of US$22,000 despite current macro pressures.
As Ethereum trading prices approach US$1,878.72 and weekly volatility hits a new low in 2026, discussions on Ethereum price forecasts are becoming increasingly intense. Buyers repeatedly held their ground near $1,855, but quickly fell back after bouncing back above $1,930. This compression trend causes the symmetrical triangle to approach the apex. At the same time, spot funds recorded a net outflow of US$2.26 million last week after five consecutive weeks of net inflows. Exchange withdrawals and weak selling pressure provided support, but resistance remained close at hand. Ethereum prices now need to close decisively above $1,920 to strengthen bullish logic. Otherwise, if support is lost, the Ethereum price forecast could shift to $1,800 in next week's trading.
Ethereum price forecast approaches key breakthrough range
Ethereum is currently close to its 20-day exponential moving average (US$1,882.14). This line tracks short-term momentum. A close above this line will improve the technical form, but stronger resistance is around $1,918 and $1,920. The 100-day moving average and parabolic SAR indicator meet in the region.

Ethereum price forecasts have become more positive after confirming a breakthrough in this resistance cluster. Such a move could open a triangular upward trajectory, close to $1,960. Breaking through that level would put the psychological threshold of $2,000 into focus. If momentum expands further, the 200-day moving average (approximately $2,129) will provide a target.
Ethereum price support starts near the 50-day moving average (approximately US$1,864). Fibonacci support is at $1,837, followed by a triangular lower rail (approximately $1,800). A break below $1,864 would weaken the structure. If it goes further below $1,837, the border may be exposed.
Prices have encountered multiple rejections on both sides this week. The seller applied pressure around US$1,930, while the buyer absorbed the selling pressure around US$1,855. Confirmation signals are more important than intraday fluctuations. Ethereum price forecasts need to be based on a close breakthrough, otherwise neither target will have sufficient weight.
Glassnode data shows that Ethereum selling pressure has dropped to its lowest level on record. The reading is below the bottom of the bear market in 2022, but an eventual surrender is still possible. This signal indicates that the seller is exhausted rather than a confirmed bottom.

Source: Glassnode
ETF outflows coexist with BitMine accumulation and macro pressure
As of August 14, the Ethereum ETF flow rate turned negative. Spot funds recorded a net outflow of US$2.26 million after five consecutive weeks of net inflows. The previous five weeks attracted US$566.12 million, with an inflow of US$244.94 million in the week ending August 7 leading the way. On August 14, all products recorded zero-day inflows.
Cumulative ETF inflows are close to US$11.45 billion, and net assets are US$10.52 billion. This reversal is smaller than previous inflows. Still, another week of net outflows could weaken institutional support for the triangular breakthrough range. By then, Ethereum price forecasts will rely more on spot demand.
On August 15, net flow from the spot exchange was negative US$3.48 million. More Ethereum transfers out of the exchange rather than into it, creating a favorable supply signal. At the same time, derivatives trading volume rose 12.04% to US$26.12 billion. Open interest fell 1.37% to $25.44 billion, indicating that traders are reducing exposure.
The total amount cleared within 24 hours was US$10.6 million. Long positions accounted for $7.39 million and short positions accounted for $3.2 million. This imbalance suggests that while ETH prices remain compressed, buyers have absorbed more forced liquidations. 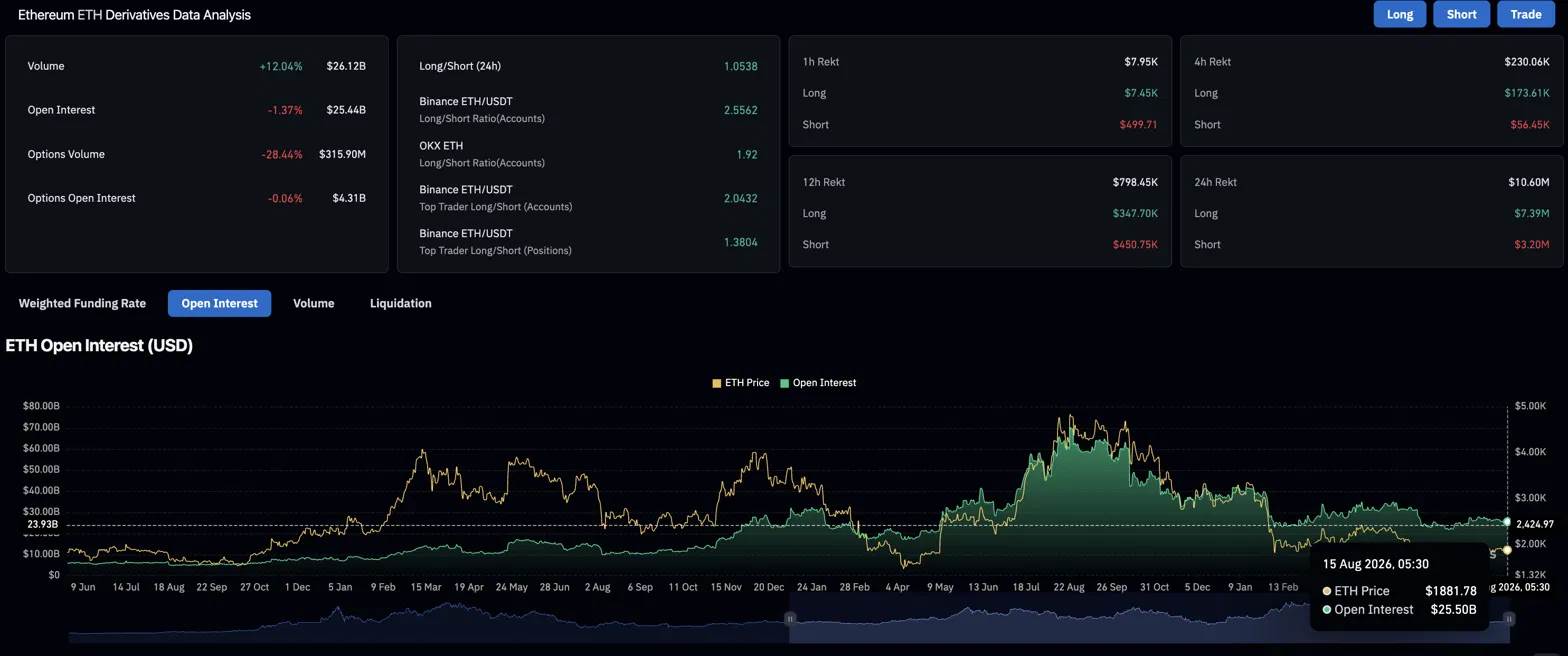 Source: Coinglass
Interest rate concerns and broader macro risks are still compressing cryptocurrency valuations. Macroeconomic conditions also affect Ethereum price forecasts. Loose financial conditions could boost demand, while further tightening could put pressure on speculative assets.
BitMine provides institutional demand signals. The company reported holding 5.81 million ETH units, accounting for 4.8% of Ethereum's total supply of 120.7 million units. Its goal is to increase its position to 5%. BitMine also pledged approximately 5.07 million ETH units through its network. The total value of positions was reported to reach US$11.6 billion.
Chairman Tom Lee predicts that ETH will reach US$22,000 within a few years. His long-term forecast ranges from $62,000 to $250,000. Neither forecast represents the current technical fundamentals. Lee linked this view to the growth of stablecoins, tokenized assets, decentralized applications, and increased institutional usage.