Exchange Ranking
 Top Exchanges
 24h Volume Ranking
 Popularity Ranking
 Exchange BTC Balance
 Proof of Reserves
 Decentralized Exchanges
 Funding Rate
 Funding Heatmap
 Liquidation Data
 Max Pain
 Long/Short Ratio
 Whale L/S Ratio
 Binance/Okex/Huobi L/S
 Bitfinex Margin L/S
 ETF Tracker
 Solana ETF
 XRP ETF
 Hong Kong ETF
 Bitcoin Treasuries
 Crypto Reversal
 Ethereum Reserves
 HyperLiquid Wallet Analysis
 Hyperliquid Whale Watch
 Large Transactions
 On-chain Movement
 Bitcoin ROI
 Stablecoin Market Cap
 Options Analysis
 News
News Articles
 Economic Calendar
 Features
 Wallet
 Contract Calculator


 Security
 Collections
 Watchlist
 Following
 ETH
ETH Summary: The triangle pattern points to a possible breakthrough to US$3,000.
Exchange outflow signals indicate that selling pressure on Ethereum has eased.
Ethereum is currently trading at US$2,543, and the triangle pattern suggests that it is expected to exceed US$3,000. Analyst Ali Charts pointed out that a similar Ethereum pattern had previously predicted a 31% surge in prices in three days. Within 96 hours, 140,000 ETH pieces worth approximately $350 million left the exchange. If this trend continues, declining exchange reserves could reduce immediate selling pressure.
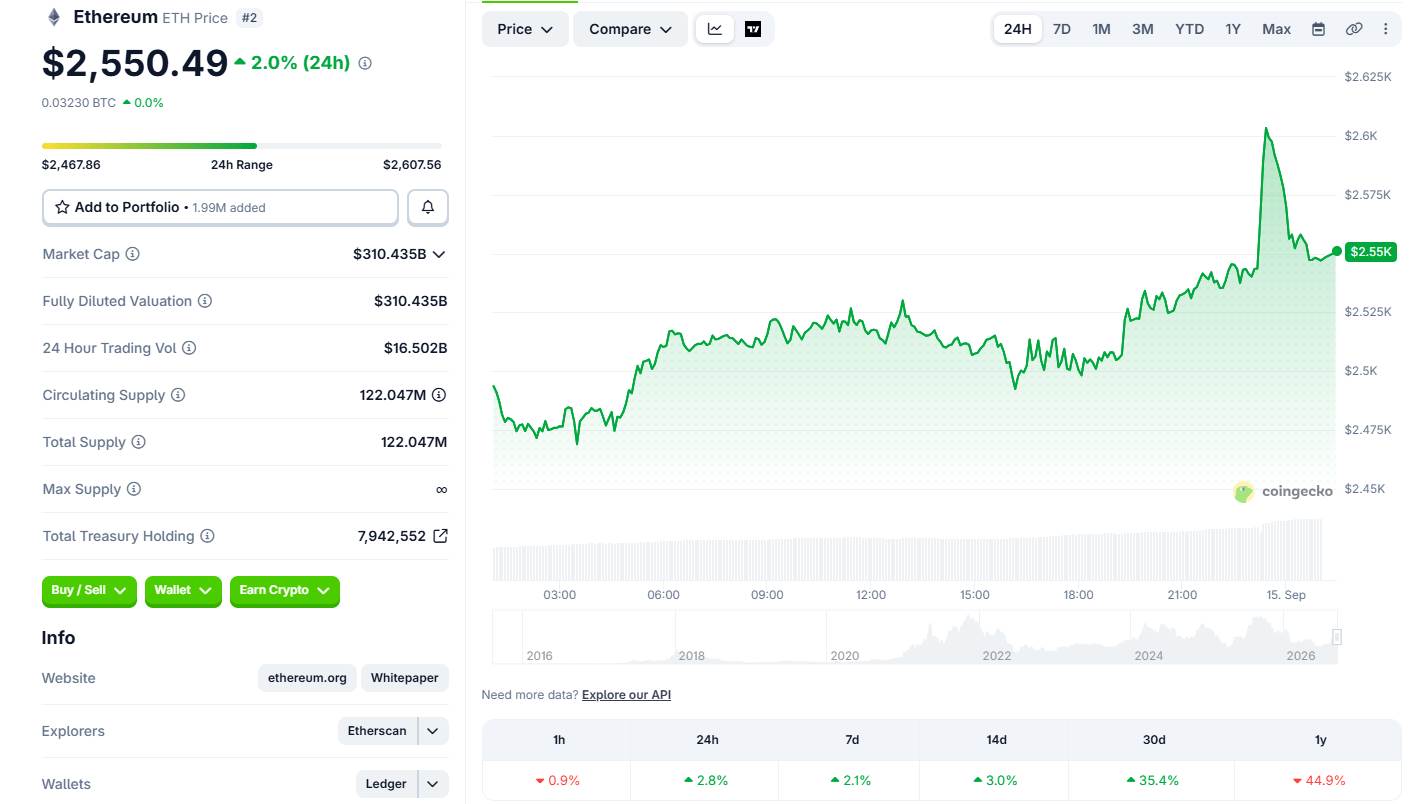
As of press time, Ethereum was trading at US$2,550.49, up 1.86% in the past 24 hours. According to the latest market data, the asset has also risen 2.0% in the past seven days. During the same 24-hour window, trading volume reached US$16.5 billion, reflecting smooth and orderly market activity.
Price movements follow the latest comments from crypto analysts who point to potential breakthrough patterns. Analysts also cited data showing a significant decrease in the number of Ethereum held on exchanges.
Triangle pattern points to a possible breakthrough to US$3,000
Chart analyst Ali Charts pointed out that a triangle pattern is forming on the Ethereum price chart. The account pointed out that a similar pattern triggered a 31% surge in three days. The previous breakthrough occurred after the triangular form was completed. Analysts believe that a new triangle is now forming on the chart.
Ethereum target price of US$3,000
A breakthrough in the last triangle sent Ethereum soaring 31% in just three days.
Now, another triangle is being formed.
If $ETH breaks through again, a similar trend could push it higher to $3,000.
- Ali Charts (@alicharts) September 13, 2026
If Ethereum breaks out of current patterns, analysis suggests the price will move towards US$3,000. This target price will be a huge increase compared to current price levels.
Triangle patterns are commonly used by traders to identify potential breakthrough points. Confirmed breakthroughs usually require prices to decisively break through the upper boundary of the pattern. Ethereum is currently trading at $2,550.49, below the target of $3,000. Reaching that level requires an increase of close to 18%.
Cryptocurrencies have recorded gains on both daily and weekly charts. The momentum of the broader market may affect whether the pattern unfolds as expected. Breakthroughs above the resistance level must be consolidated to verify the effectiveness of this pattern. Trading volume during potential breakout periods is usually monitored to confirm the strength of the increase. The $3,000 mark marks a key psychological threshold for Ethereum.
Exchange outflow signal shows Ethereum selling pressure has eased
Another article by Ali Charts pointed to the large outflow of Ethereum from exchanges. Within 96 hours, approximately 140,000 ETH pieces (worth nearly $350 million) left the exchange wallet. A withdrawal of this size suggests that the holder is moving Ethereum to private storage. Exchange outflows are often tracked as a measure of holder behavior.
US$350 million worth of Ethereum leaves the exchange
In the past 96 hours, approximately 140,000 ETH (worth approximately US$350 million) have been withdrawn from the exchange.
This suggests that investors are increasingly inclined to hold rather than trade.
As the $ETH available on exchanges decreases, there is a potential...
- Ali Charts (@alicharts) September 14, 2026
When Ethereum leaves the exchange, it often becomes less easy to use for instant sales. Reducing the number of coins remaining on the exchange reduces potential selling pressure. Holders moving assets off the exchange usually sends a signal of long-term holding. This pattern has been observed during previous periods of price increases.
Ethereum prices have gone higher as exchange reserves have reportedly dropped. A daily increase of 1.86% and a weekly increase of 2.0% are accompanying this outflow trend. Total trading volume in the past 24 hours was $16.5 billion. This level of activity suggests that both buyers and sellers continue to participate in the market.
Exchange balance data is often used in conjunction with price charts to assess market conditions. Analysts often combine outflow data with technical forms to get a more comprehensive picture. Both data points released this week point to a decrease in available supply. Ethereum's next move will depend on how these factors develop further.