Exchange Ranking
 Top Exchanges
 24h Volume Ranking
 Popularity Ranking
 Exchange BTC Balance
 Proof of Reserves
 Decentralized Exchanges
 Funding Rate
 Funding Heatmap
 Liquidation Data
 Max Pain
 Long/Short Ratio
 Whale L/S Ratio
 Binance/Okex/Huobi L/S
 Bitfinex Margin L/S
 ETF Tracker
 Solana ETF
 XRP ETF
 Hong Kong ETF
 Bitcoin Treasuries
 Crypto Reversal
 Ethereum Reserves
 HyperLiquid Wallet Analysis
 Hyperliquid Whale Watch
 Large Transactions
 On-chain Movement
 Bitcoin ROI
 Stablecoin Market Cap
 Options Analysis
 News
 Articles
 Economic Calendar
 Features
 Wallet
 Contract Calculator


 Security
 Collections
 Watchlist
 Following
 ETC
Ethereum Classic (ETC) October 2026 Price Forecast
Search popularity for October 2026 is rising, and Ethereum Classic (ETC) has been building a market structure that traders look back repeatedly. One key price point determines whether the deal is worth paying off, while the other determines whether the logic fails completely. The editorial team does not take any personal position on this currency. This article is based only on objective interpretation based on charts and data.
Quick conclusion:
In the October 2026 ETC price forecast, the current trading price is $8.95. If the daily line closes firmly above $10.08, the target is looking at $18.85, followed by $25.90; if the daily line closes below $6.02, the trading setting will expire.
ETC Price Today: Real-time market data and snapshot of open interest
The current market price (CMP) is $8.95. The market value is US$1.41 billion. 24-hour futures volume was US$62.22 million, and spot volume was US$8.22 million. The total value of open interest (or the total value of unsettled futures contracts) was US$129.74 million. The circulation supply is 158.38 million pieces, with the maximum supply of 210.7 million pieces.
This update is based on charts and derivatives data, so any reader following Ethereum Classic Today's News should view it as a technical perspective rather than a reaction to a specific event.
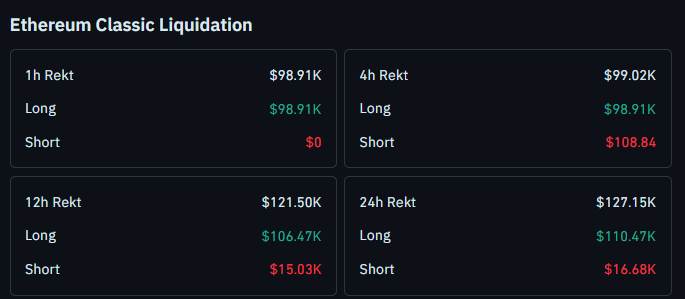 ETC Market Outlook: Liquidation, Open Interest and Market Positioning
Futures trading volume was US$62.22 million, approximately 7.6 times the spot trading volume of US$8.22 million. In the past 24 hours, a total of US$127.15 million has been liquidated, of which US$110.47 million has been liquidated for long positions and US$16680 has been liquidated for short positions. Most of the liquidations occurred within a one-hour window: long liquidations of $98.91 million and short liquidations of $0. Compared with the $129.74 million in open interest, this was a minor purge and more like a few overleveraged buyers being shaken out than a broad market wash.
Key Points: ETC price targets and breakthrough levels Overview
- The currency security daily chart shows that the current price is $8.95.
- Prices held on to an uptrend line after experiencing higher highs.
- Daily closing above $10.08 points target at $18.85, followed by $25.90.
- Daily closing below $6.02 will invalidate this trading setting.
Ethereum Classic Technical Analysis: Trend Line Support and Daily Chart
Methodology: ETC/USDT, Daily Time Frame, Binance Exchange, with RSI Divergence as Indicator. If the daily close is below $6.02, this setting is invalid.
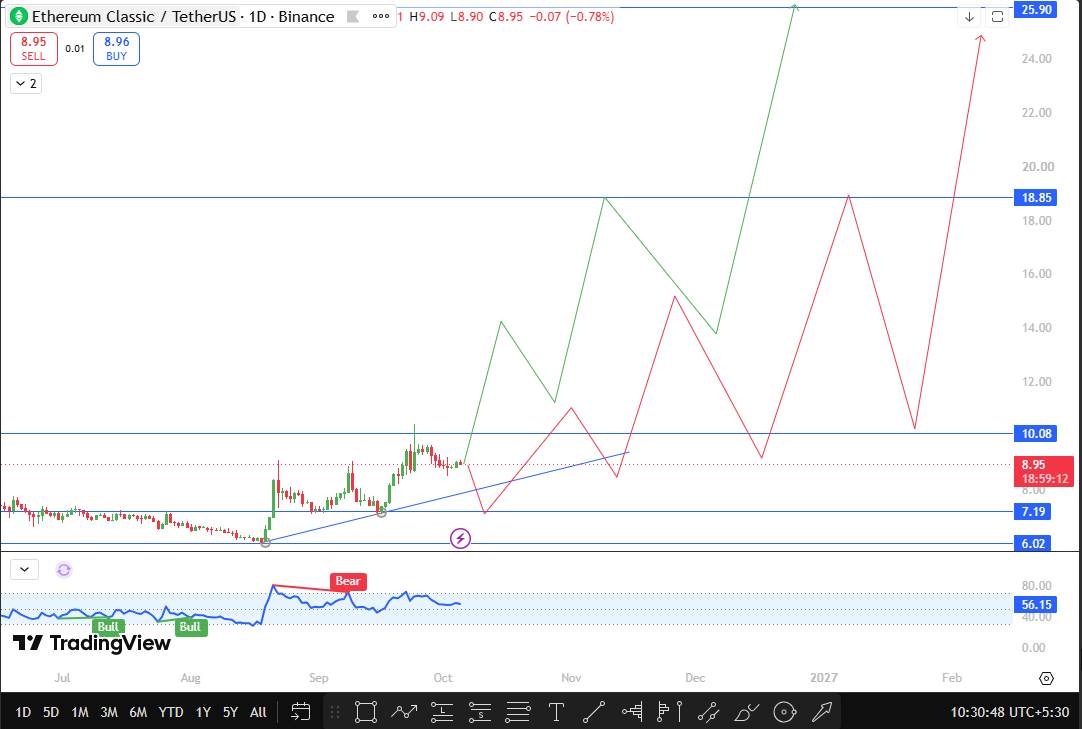 After consolidating at summer lows, Ethereum Classic began to climb along an uptrend line. The two previous touches to this trend line have led to the formation of higher highs. The latest attempt to rise was blocked and retreated in the $10.08 area, prices held on to the structure after a correction and have started to rise again from $8.95.
The RSI divergence reading was 56.15. There were two bullish signals in July and August before the market started. A bearish signal emerged in September, when prices hit higher highs, but the RSI divergence showed a lower peak. This is the main warning point in this ETC technical analysis. As long as prices remain above the trend line, the overall trend analysis remains constructive.
Ethereum Classic Price Forecast: Support and Resistance Levels ahead
Importance of Level Type Distance from Current Price $25.90 Resistance Primary Target +189.39%$18.85 Resistance Second Upward Target +110.61%$10.08 Resistance Breakthrough Trigger Point +12.63%$8.95 Current Price- 0% $6.02 Support Level Set Failure Point-32.74% ETC October 2026 Forecast: Bullish, Benchmark and Bear Scenarios
Bullish Scenarios: Daily closes firmly above $10.08, opening up $18.85 and $25.90 spaces
The confirmation signal requires daily to close above $10.08, which is the last time prices were blocked and retreated. The first ETC price target is $18.85, with the main resistance at $25.90. If the trend line is held during backtesting, the breakthrough will be cleaner; if the daily line closes back below $10.08, the breakthrough will weaken.
Baseline scenario: Volatility in the range of $6.02 to $10.08, supported by trend line
若日线级别没有突破任一水平,价格将在这一宽幅区间内继续震荡。只要从趋势线再次反弹,就能保持低点逐步抬高的形态。若在$10.08处反复遭到拒绝,则表明买方力量正在衰竭。
看跌情景:日线收盘跌破$6.02使设置失效
日线收盘低于$6.02将取消看涨逻辑。图表上没有设定下行目标,因为在此位置交易设置直接停止有效。如果价格先失去趋势线且无法收回,该下跌走势的权重会增加;如果买方迅速将价格推回$6.02上方,则权重减轻。
ETC价格预测的风险与设置失效规则
价格曾在$10.08处受阻回落一次,没有任何保证第二次尝试会有不同结果。两个上行目标距离当前价格较远,分别为+110.61%和+189.39%,因此这是一个长线设置。由于缺乏已确认的以太坊经典利好消息推动,若突破未能维持,价格可能迅速回落至趋势线附近。日线收盘低于$6.02将终结该逻辑。
以太坊经典趋势分析:结论与下一步价格走势
Prices respected their uptrend line, hit a higher high, and are climbing again from $8.95. The key to all current ETC forecasts is $10.08. A daily close above this level would make $18.85 and $25.90 potential targets, while a daily close below $6.02 would end the setting.