Exchange Ranking
 Top Exchanges
 24h Volume Ranking
 Popularity Ranking
 Exchange BTC Balance
 Proof of Reserves
 Decentralized Exchanges
 Funding Rate
 Funding Heatmap
 Liquidation Data
 Max Pain
 Long/Short Ratio
 Whale L/S Ratio
 Binance/Okex/Huobi L/S
 Bitfinex Margin L/S
 ETF Tracker
 Solana ETF
 XRP ETF
 Hong Kong ETF
 Bitcoin Treasuries
 Crypto Reversal
 Ethereum Reserves
 HyperLiquid Wallet Analysis
 Hyperliquid Whale Watch
 Large Transactions
 On-chain Movement
 Bitcoin ROI
 Stablecoin Market Cap
 Options Analysis
 News
 Articles
 Economic Calendar
 Features
 Wallet
 Contract Calculator


 Security
 Collections
 Watchlist
 Following
 BTC
 DOGE
TLDR
momentum indicators send mixed signals, and derivatives data are biased towards bullish. DOGE rose 3.54% to a key resistance level of $0.10 on Monday. The major moving averages are all at $0.09, slightly below current prices. Top traders hold 76.6% of long positions, with an active buy/sell ratio of 1.41. Open interest fell 7.28% in 24 hours, while prices remained around $0.10. Analysts believe that if the breakthrough is successful, the next target will be US$0.12, and the primary support level will be US$0.09.
Catalog
Momentum indicators send mixed signals
Dogecoin (DOGE) rose 3.54% to US$0.10 on Monday. This price is currently the main level that traders pay close attention to. The $0.10 mark coincides with strong resistance levels, immediate resistance levels and the upper trajectory of the Bollinger Band. Three different indicators point to the same upper limit.
Below the price, all key moving averages are at $0.09. This includes simple moving averages (SMA) for 7, 20, 50 and 200 cycles, as well as exponential moving averages (EMA). Trading above all of these moving averages suggests a bullish trend structure. Not long ago, DOGE's trading price was still close to its Bollinger Band below around $0.08.
Relative Strength Index (RSI)
Relative Strength Index (RSI) is 59. The reading is neutral and strong, with room for improvement before reaching overbought levels above 70. The Bollinger Band %B reading is 0.66, indicating that prices are in the upper half of the Bollinger Band. DOGE is hitting resistance, not moving away from it.
MACD indicator
However, the MACD histogram is exactly zero. The MACD line and its signal line have fully converged, which may mean that the buyer has suspended action at resistance.
Stochastic Oscillator
Stochastic Oscillator shows %K as 39 and %D as 31. According to analysis by Blockchain.news analyst Luisa Crawford, this suggests that recent gains have been driven by spot purchases rather than momentum chases.
Average true volatility (ATR)
Average true volatility (ATR) is US$0.01, indicating moderate daily price volatility. During a single trading session, prices could break through $0.10 or fall back to $0.09.
Derivatives data is biased towards bullish
The active buy/sell ratio is 1.41. In the most recent measured hour, buy volume reached $86 million, while sell volume was $61 million. Top traders hold 76.6% of long positions, with a long-short ratio of 3.28. Retail traders also hold large amounts of short positions, with 71%.
Open interest has dropped 7.28% in the past 24 hours. This means that while prices remain high, some positions have been closed or liquidated.
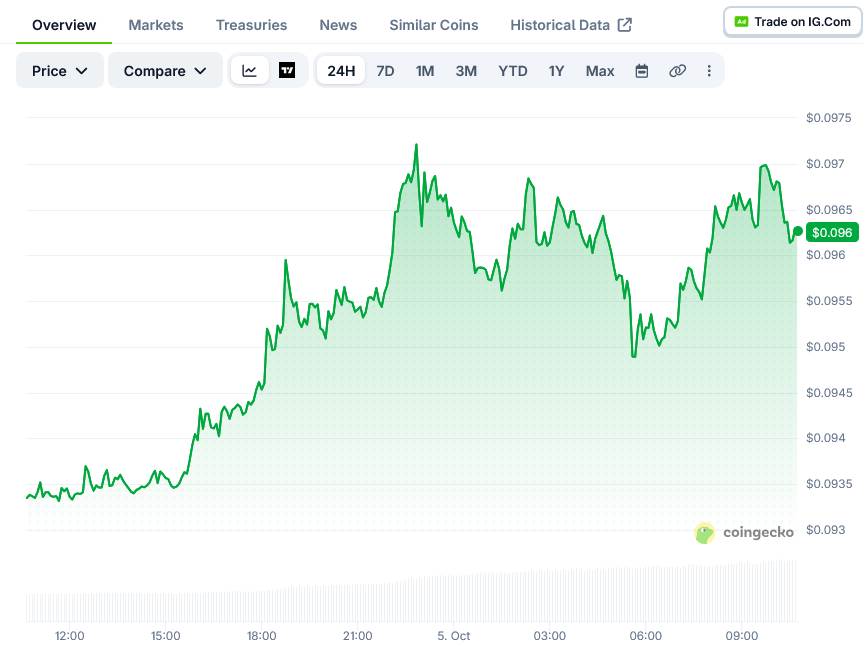
Dogecoin price movement on CoinGecko
Funding rates are at neutral 0.01%. Traders have not yet paid a premium to hold positions. Crawford's analysis puts the probability of a bullish outcome at 55%. In this case, a daily close above $0.10 may open a path to $0.12, with an extended target of $0.13 to $0.14.
The probability of a bearish situation is 45%. If DOGE fails to close above $0.10 in the next two to three trading sessions and the MACD turns negative, the price may fall back to the support level of $0.09. A break below $0.09 may lead DOGE to move towards $0.08 below the Bollinger Line. This would result in a decline of about 20%, while a daily close above $0.105 would invalidate the bearish situation.
Analysis also pointed out that Bitcoin (BTC) is the main driver of DOGE in the next 30 days. The price direction of DOGE is still closely related to BTC.
As of last check, DOGE was trading at US$0.10, down 0.12% in the latest one-minute reading.