Exchange Ranking
 Top Exchanges
 24h Volume Ranking
 Popularity Ranking
 Exchange BTC Balance
 Proof of Reserves
 Decentralized Exchanges
 Funding Rate
 Funding Heatmap
 Liquidation Data
 Max Pain
 Long/Short Ratio
 Whale L/S Ratio
 Binance/Okex/Huobi L/S
 Bitfinex Margin L/S
 ETF Tracker
 Solana ETF
 XRP ETF
 Hong Kong ETF
 Bitcoin Treasuries
 Crypto Reversal
 Ethereum Reserves
 HyperLiquid Wallet Analysis
 Hyperliquid Whale Watch
 Large Transactions
 On-chain Movement
 Bitcoin ROI
 Stablecoin Market Cap
 Options Analysis
 News
 Articles
 Economic Calendar
 Features
 Wallet
 Contract Calculator


 Security
 Collections
 Watchlist
 Following
 XRP
On August 19th, the value of XRP briefly dropped below the $3.00 psychological barrier, reaching a low of $2.97. This marked a new low in just 11 days. With increasing geopolitical tensions and overall market fluctuations, renowned analyst Ali Martinez warned that if XRP fails to regain the $3.30 resistance level, it could experience a sharp decline of up to 33%, potentially hitting levels as low as $2.60 or even $2.00. However, technical indicators and institutional movements suggest that there is potential for a rebound.
In this critical moment, XRP fell below the $3 psychological threshold.
Early Monday morning, while most investors were still asleep, the price of XRP dropped steadily to $2.97. Although it later rebounded slightly above $3.00, the vulnerability of the market became evident. Over the past 24 hours, XRP declined by 4.7%, making it the second worst-performing asset among the top ten cryptocurrencies, after Solana(SOL).
What’s more alarming is that this decline was accompanied by a 94% increase in trading volume, indicating that selling pressure is intensifying. Such a discrepancy between price and volume usually indicates that the trend will continue—either as a sign of panic-selling, or as a signal that bearish forces are about to run out.
Technical indicators are showing contradictory signals: a battle between bulls and bears is imminent.
Current technical indicators show a split situation, with both bulls and bears having valid arguments.
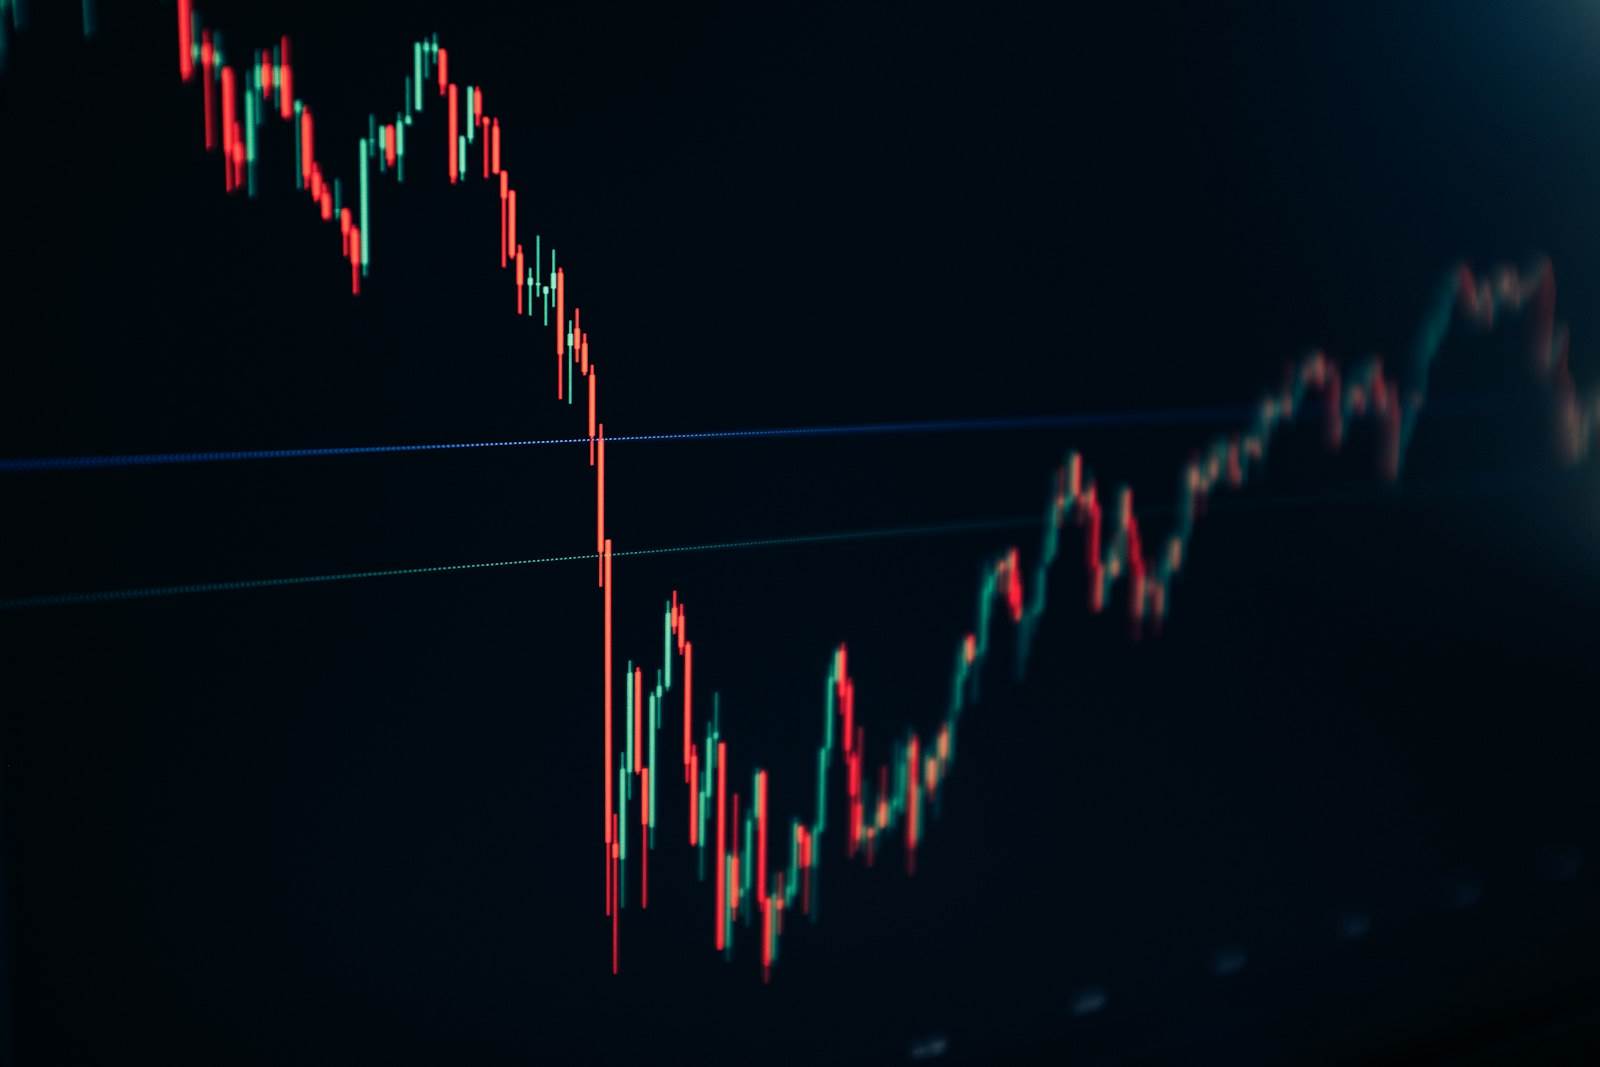
1. Clear signs of bearish trend: On the 4-hour chart, the MACD continues to show a bearish trend, and the SuperTrend indicator turned negative at $3.15. The Bollinger Bands indicate that prices are continuing to move below the lower band, suggesting that the downward trend may continue rather than reverse. More importantly, XRP has broken below the EMA cluster around $3.10 (20/50/100/200-day moving averages). This area has now become a resistance level.
2. Initial signs of rebound: The 30-minute RSI is stuck in a sell-off zone of 22.3, indicating that bearish momentum may have exceeded its limits. Historically, such extreme readings often lead to technical rebounds. Additionally, chain data shows that $2.81 represents a key support level. Approximately 1.7 million XRPs were accumulated by institutions at this price, forming what can be called a “whale defense line”.
Geopolitical factors and unlocking events: Underexpected factors driving the decline
This decline is not an isolated event. Former U.S. President Trump’s comments regarding the Russia-Ukraine conflict triggered increased risk aversion in the market, putting pressure on high-risk assets. At the same time, Ripple conducted a large-scale transfer of 200 million XRPs (worth approximately $606 million) on August 16 to an unknown wallet.
While some analysts interpret this as an adjustment in ODL (On-Demand Liquidity) operations or institutional cooperation, the market remains concerned that this could be a precursor to further selling. Coincidentally, the circulating supply of XRP has increased by 3 billion units over the past year. The balance between supply and demand remains a key factor affecting prices.
Light of hope: Three long-term fundamentals that remain stable
Institutions begin to enter the market after legal risks are resolved
At the beginning of August, after the SEC reached a settlement with Ripple (resulting in a fine of $125 million for Ripple Payments), the regulatory concerns finally subsided. This milestone event immediately stimulated increased institutional activity: 1. The open positions in XRP futures increased by 22% within 24 hours, reaching new highs for the year
. 2. Major traders increased their holdings of XRP by over 900 million units within 48 hours (approximately $2.88 billion)
. 3. The daily volume of transactions on the XRP ledger (XRPL) reached 214,000 transactions, a 4280% increase compared to 2013
. ETF expectations: A 75% probability of price appreciation due to the multiplier effect
. Several American exchanges have submitted applications for XRP ETFs. Steven McClurg, CEO of Canary Capital, predicts that approval will be granted “soon this year.” Current market estimates suggest a 75% probability of approval. According to Gemini AI’s calculations, if $5 billion in capital flows into the market in the first month: 1. The market value of XRP would rise to $236.5 billion – $261.5 billion (equivalent to $3.99 – $4.41 per unit)
. 2. With a multiplier effect of 272 times, the valuation could reach $1.546 trillion per unit of XRP (approximately $26 per unit)
. 3. The ecosystem continues to expand, from cross-border payments to healthcare finance
. Despite market pressure, the XRP ecosystem continues to grow steadily. Wellgistics Health Inc., a NASDAQ-listed company, announced the deployment of its payment system on XRPL, serving over 6,500 pharmacies and 200 manufacturers across the United States. This system aims to address issues such as bank delays and high credit card fees associated with drug inventory payments, marking another example of how blockchain can transform traditional finance
. Key price levels and strategies: A guide for traders’ decision-making
当前 XRP 处于狭小区间震荡——下方 2.81 美元为生死线,上方 3.30 美元为反弹门坎。突破任一边界都将触发剧烈波动:
1、看涨情境:若日内收复 3.10 美元 EMA 簇并突破 3.30 美元阻力,目标将指向 3.46 美元(对称三角形态目标位)及 3.66 美元。
2、看跌情境:若 2.81 美元支撑失守,可能引发连锁抛售,下探 2.72 美元甚至 2.50 美元。
对于投资者,3.22 美元被视为防守位,突破 3.35 美元后可分批布局,目标 4.50 – 5.00 美元;若跌破 3.15 美元则转向观望。
未来展望
随着比特币在 11.5 万美元附近波动,加密货币市场的焦虑情绪蔓延。94% 的 XRP 持有者目前处于盈利状态,这一数字接近 2018 年(暴跌 95%)和 2021 年(暴跌 85%)崩盘前水平。历史不会简单重演,但警示值得关注。
不过,真正的转折点可能在 ETF。若 BlackRock 等机构如市场预期在近日提交申请,XRP 可能复刻比特币 ETF 获批后的资本海啸,将当下的危机转化为突破 5 美元的跳板。市场在恐惧中抛售,但希望总在绝望中萌芽。