Exchange Ranking
 Top Exchanges
 24h Volume Ranking
 Popularity Ranking
 Exchange BTC Balance
 Proof of Reserves
 Decentralized Exchanges
 Funding Rate
 Funding Heatmap
 Liquidation Data
 Max Pain
 Long/Short Ratio
 Whale L/S Ratio
 Binance/Okex/Huobi L/S
 Bitfinex Margin L/S
 ETF Tracker
 Solana ETF
 XRP ETF
 Hong Kong ETF
 Bitcoin Treasuries
 Crypto Reversal
 Ethereum Reserves
 HyperLiquid Wallet Analysis
 Hyperliquid Whale Watch
 Large Transactions
 On-chain Movement
 Bitcoin ROI
 Stablecoin Market Cap
 Options Analysis
 News
 Articles
 Economic Calendar
 Features
 Wallet
 Contract Calculator


 Security
 Collections
 Watchlist
 Following
 DOGE
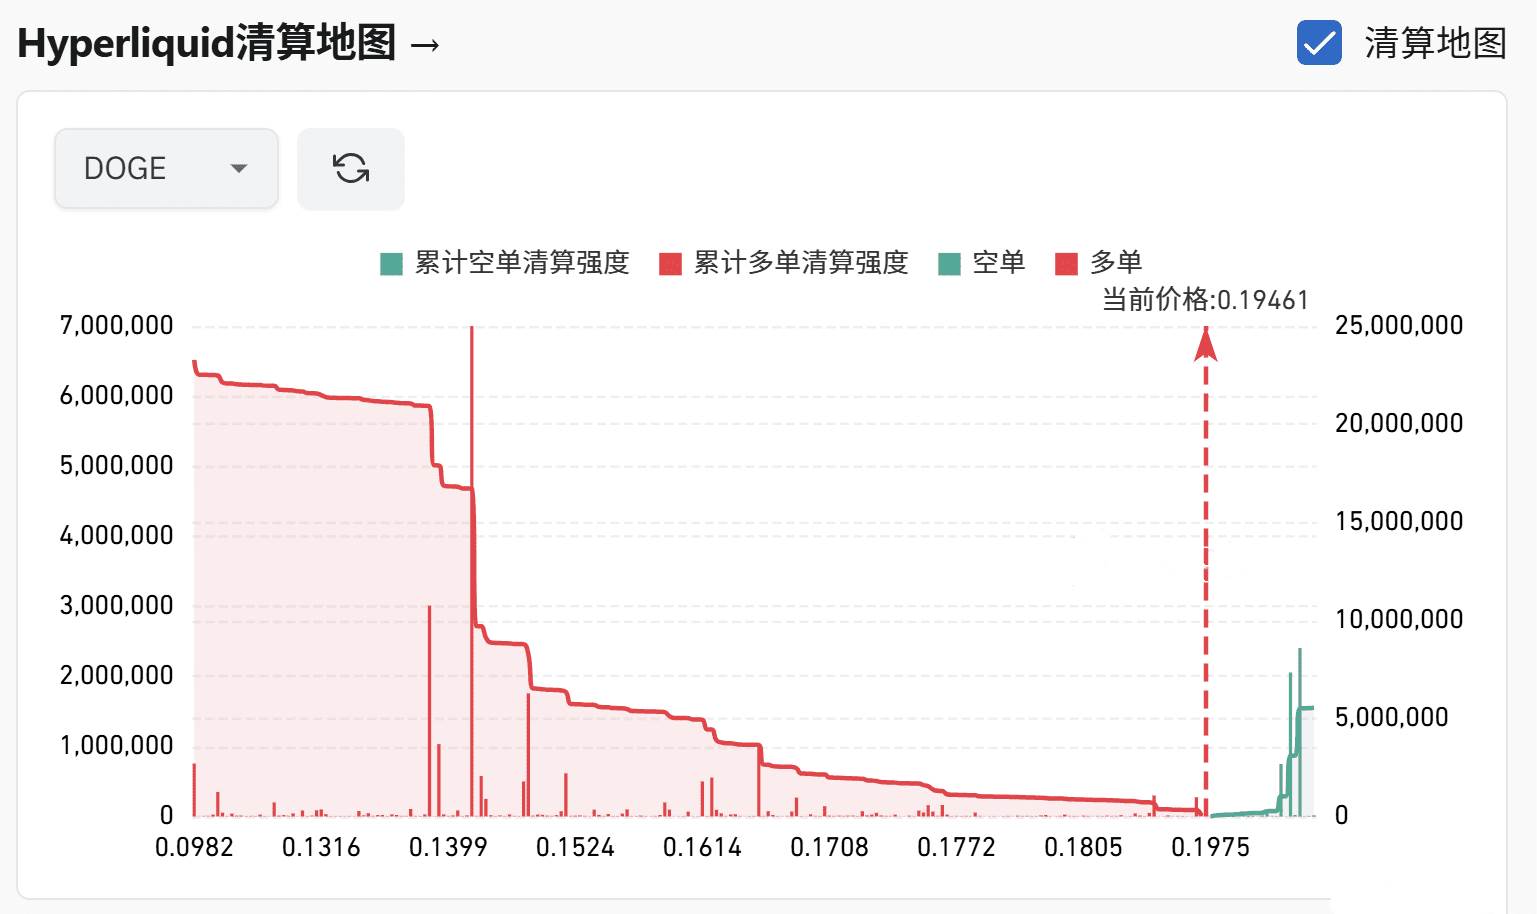
The market fluctuations of Dogecoin have once again attracted the attention of investors. Chain-level data shows that some large whales have continued to increase their positions recently, while individual traders have been frequently liquidated due to high leverage operations. This creates a stark contrast. Currently, the liquidation map for Dogecoin indicates potential margin calls at several key price levels. Market sentiment is also fluctuating between optimism and caution. In the short term, this “power play among whales” could become the trigger for the next wave of market movements.
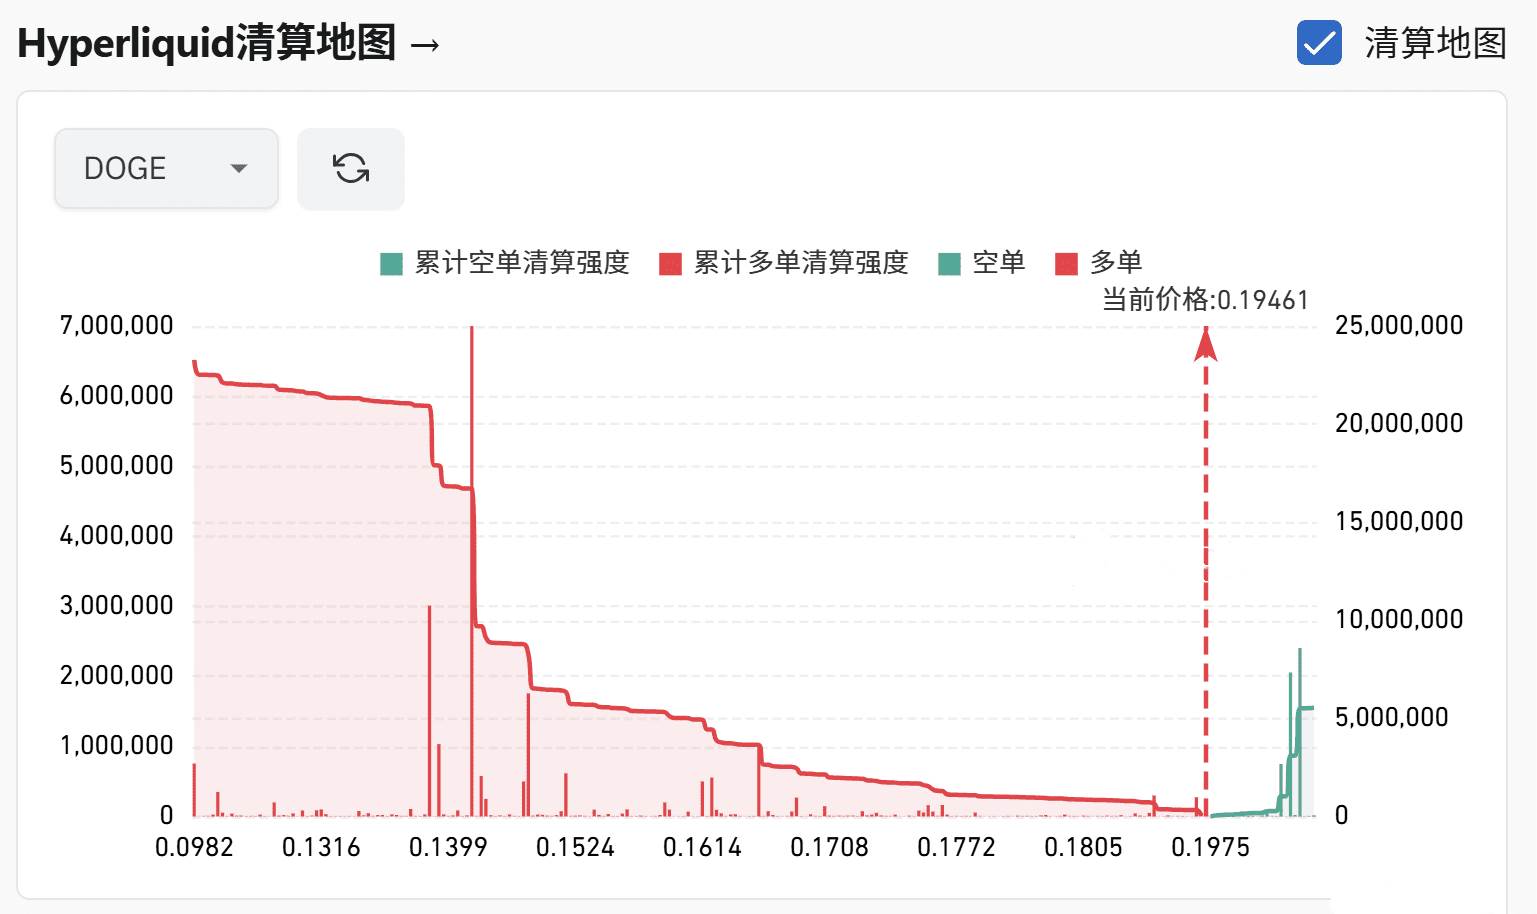
1. Distribution of long and short liquidations
Long liquidations (red areas): There is significant intensity around the price range of 0.0982 – 0.1975. This reflects that during the recent decline in Dogecoin prices from high levels, many long positions were forced to be liquidated due to price drops. These areas represent the “stop-loss zones” for previous long positions.
Short liquidations (green areas): There is significant short liquidation activity above the price level of 0.1975. This means that if Dogecoin prices continue to rise above 0.1975, it will trigger the forced liquidation of many short positions (i.e., buying stops). This creates a positive cycle: “short liquidation → price increase → more short liquidations”.
2. Key price levels and market dynamics
The current price of 0.19461 is close to the key short-liquidation level of 0.1975:
The “pressure from selling” from short liquidations below the price level of 0.1975 has been absorbed in the past, so there is less short-term pressure on long positions. Above 0.1975, there is strong “potential buying pressure” from short liquidations. If prices break through 0.1975, this trend of short liquidations could become a major driver of price increases.
3. Short-term market insights
In the short term, market sentiment favors a bullish trend. If DOGE can maintain its position above 0.19461 and break through 0.1975, then the selling orders that have been liquidated could trigger a rise in prices. However, if prices fall back, since the support from the selling orders has already been exhausted in the past, the potential for further declines may be limited (it’s necessary to consider other indicators to confirm this).
This chart shows that there is significant selling pressure on DOGE currently, which could serve as a potential catalyst for an increase in prices. In the short term, it’s important to pay attention to any breakout from 0.1975. Bullish opportunities are worth considering.