Exchange Ranking
 Top Exchanges
 24h Volume Ranking
 Popularity Ranking
 Exchange BTC Balance
 Proof of Reserves
 Decentralized Exchanges
 Funding Rate
 Funding Heatmap
 Liquidation Data
 Max Pain
 Long/Short Ratio
 Whale L/S Ratio
 Binance/Okex/Huobi L/S
 Bitfinex Margin L/S
 ETF Tracker
 Solana ETF
 XRP ETF
 Hong Kong ETF
 Bitcoin Treasuries
 Crypto Reversal
 Ethereum Reserves
 HyperLiquid Wallet Analysis
 Hyperliquid Whale Watch
 Large Transactions
 On-chain Movement
 Bitcoin ROI
 Stablecoin Market Cap
 Options Analysis
 News
 Articles
 Economic Calendar
 Features
 Wallet
 Contract Calculator


 Security
 Collections
 Watchlist
 Following
 SOL
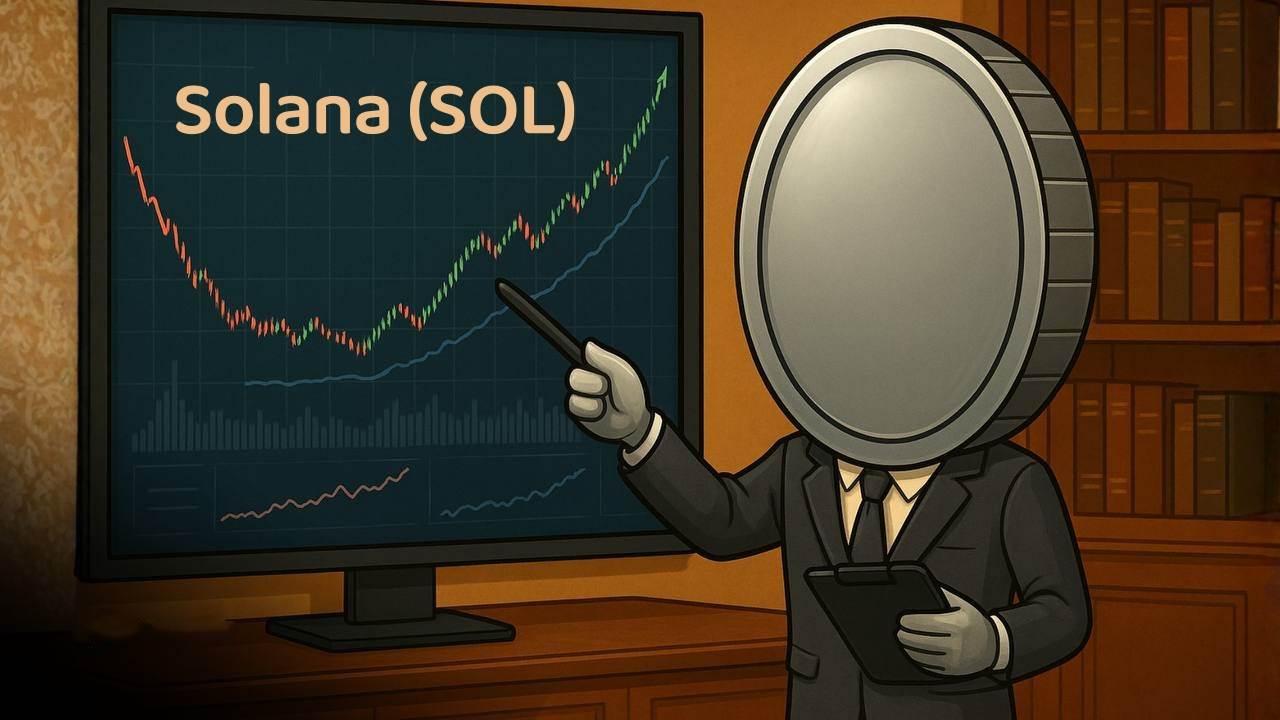
$SOL’s price has dropped to $123, slightly above the possible bottom of $121. This could indicate a double bottom formation, suggesting that lows have been reached, and a significant upward trend is about to begin.
$SOL’s price has reached the double bottom?
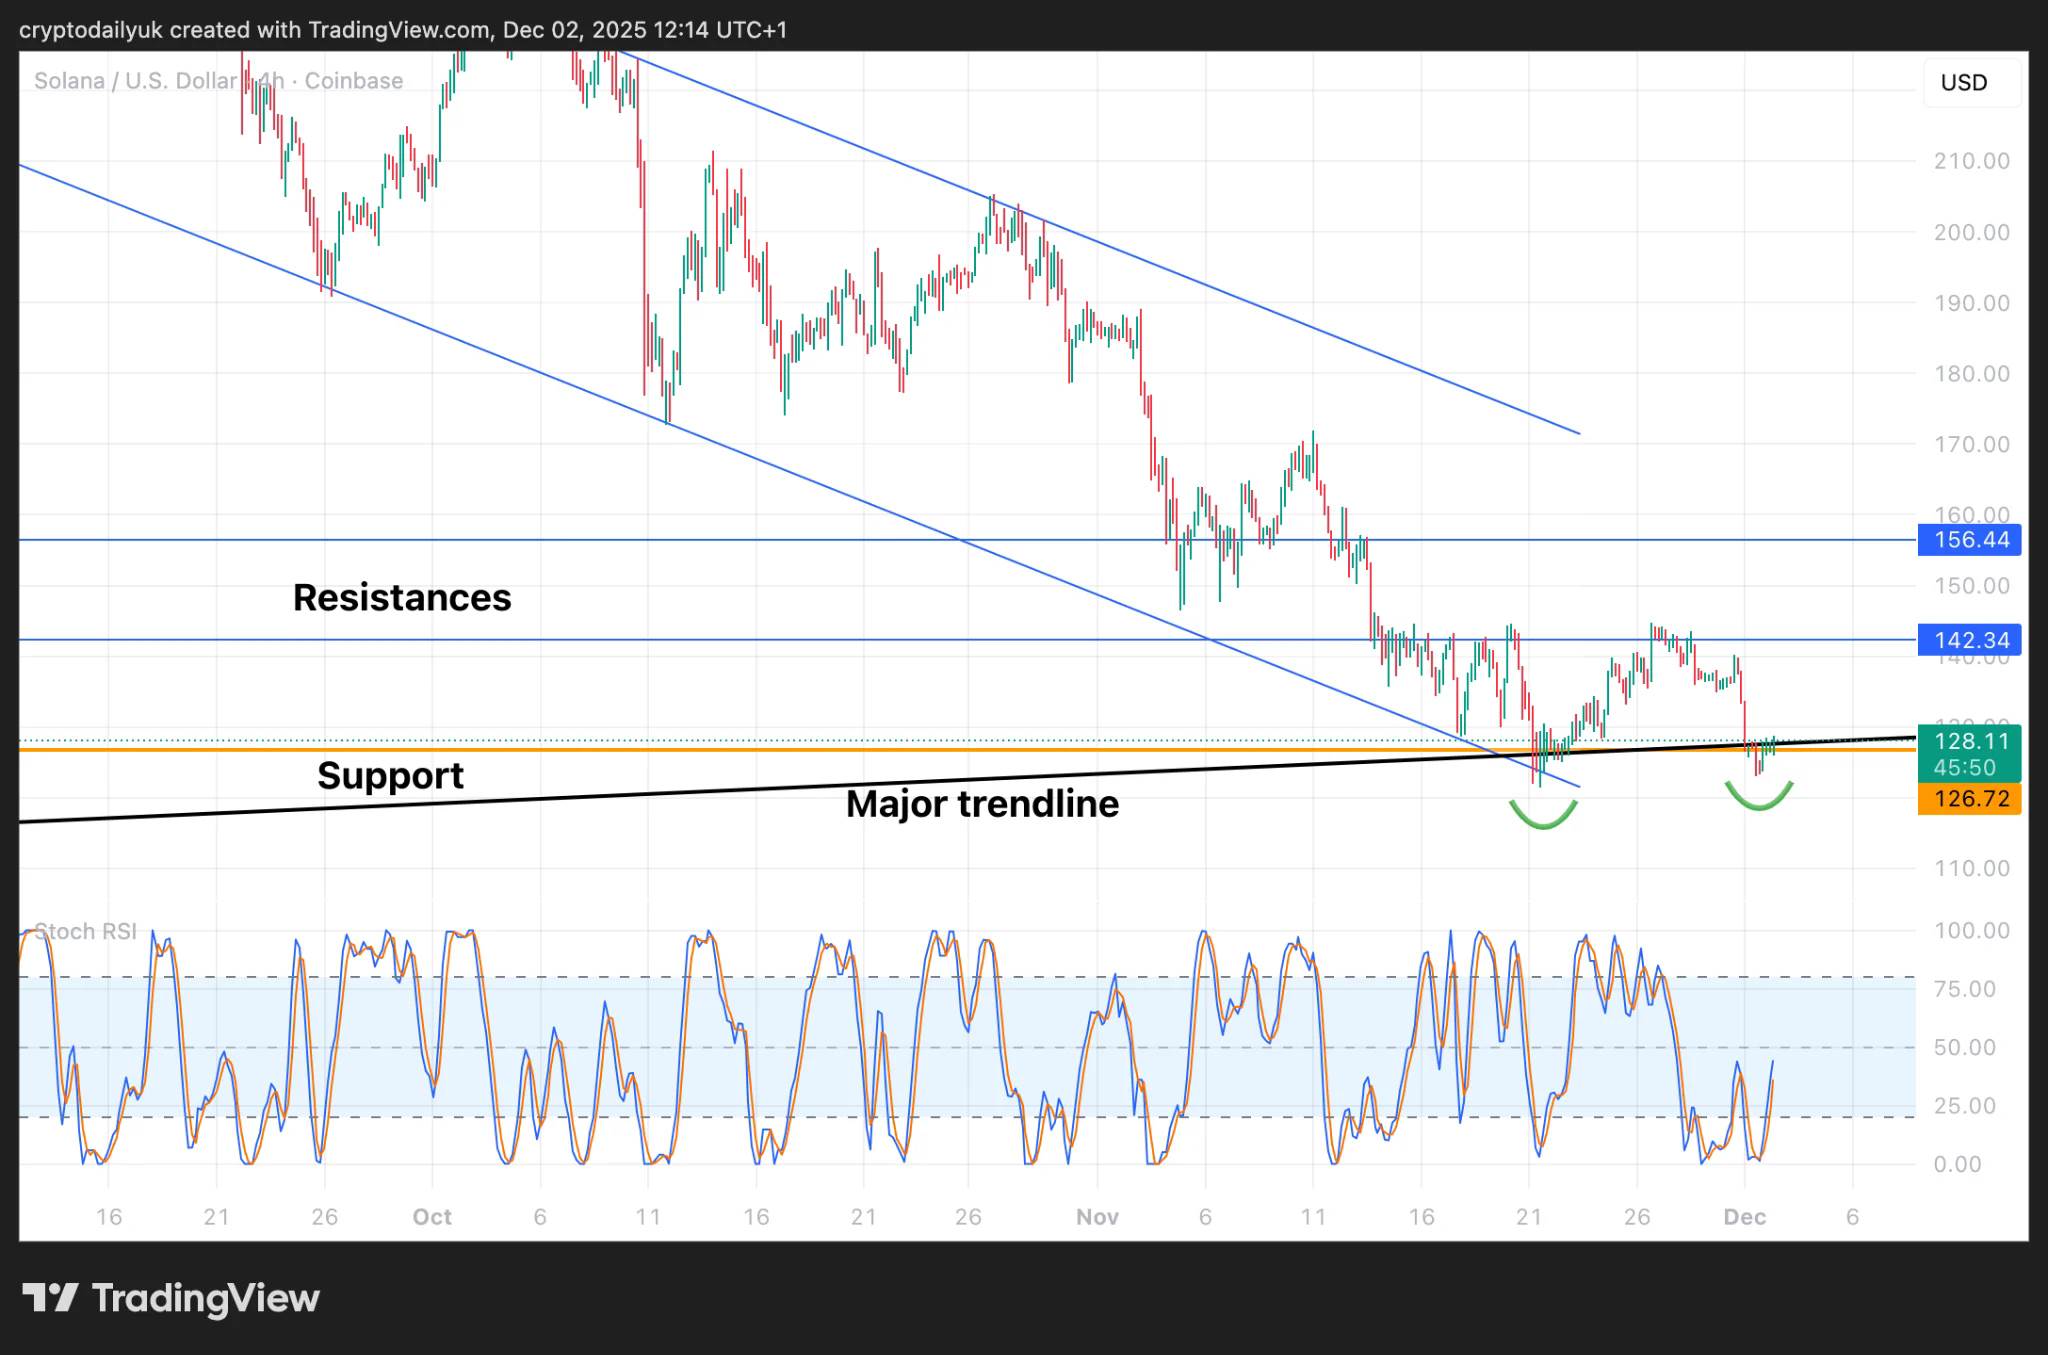
A 4-hour chart of $SOL shows that prices are fluctuating within a downward channel, with resistance from below. However, this channel is currently facing strong resistance: an important uptrend line and a very strong support level. I
It can be seen that prices are trying to regain control of these major support levels. With the Stochastic RSI indicator returning to its upper range, it indicates increased momentum for price increases. It shouldn’t be difficult for prices to regain control of these support levels.
$SOL’s next price targets are
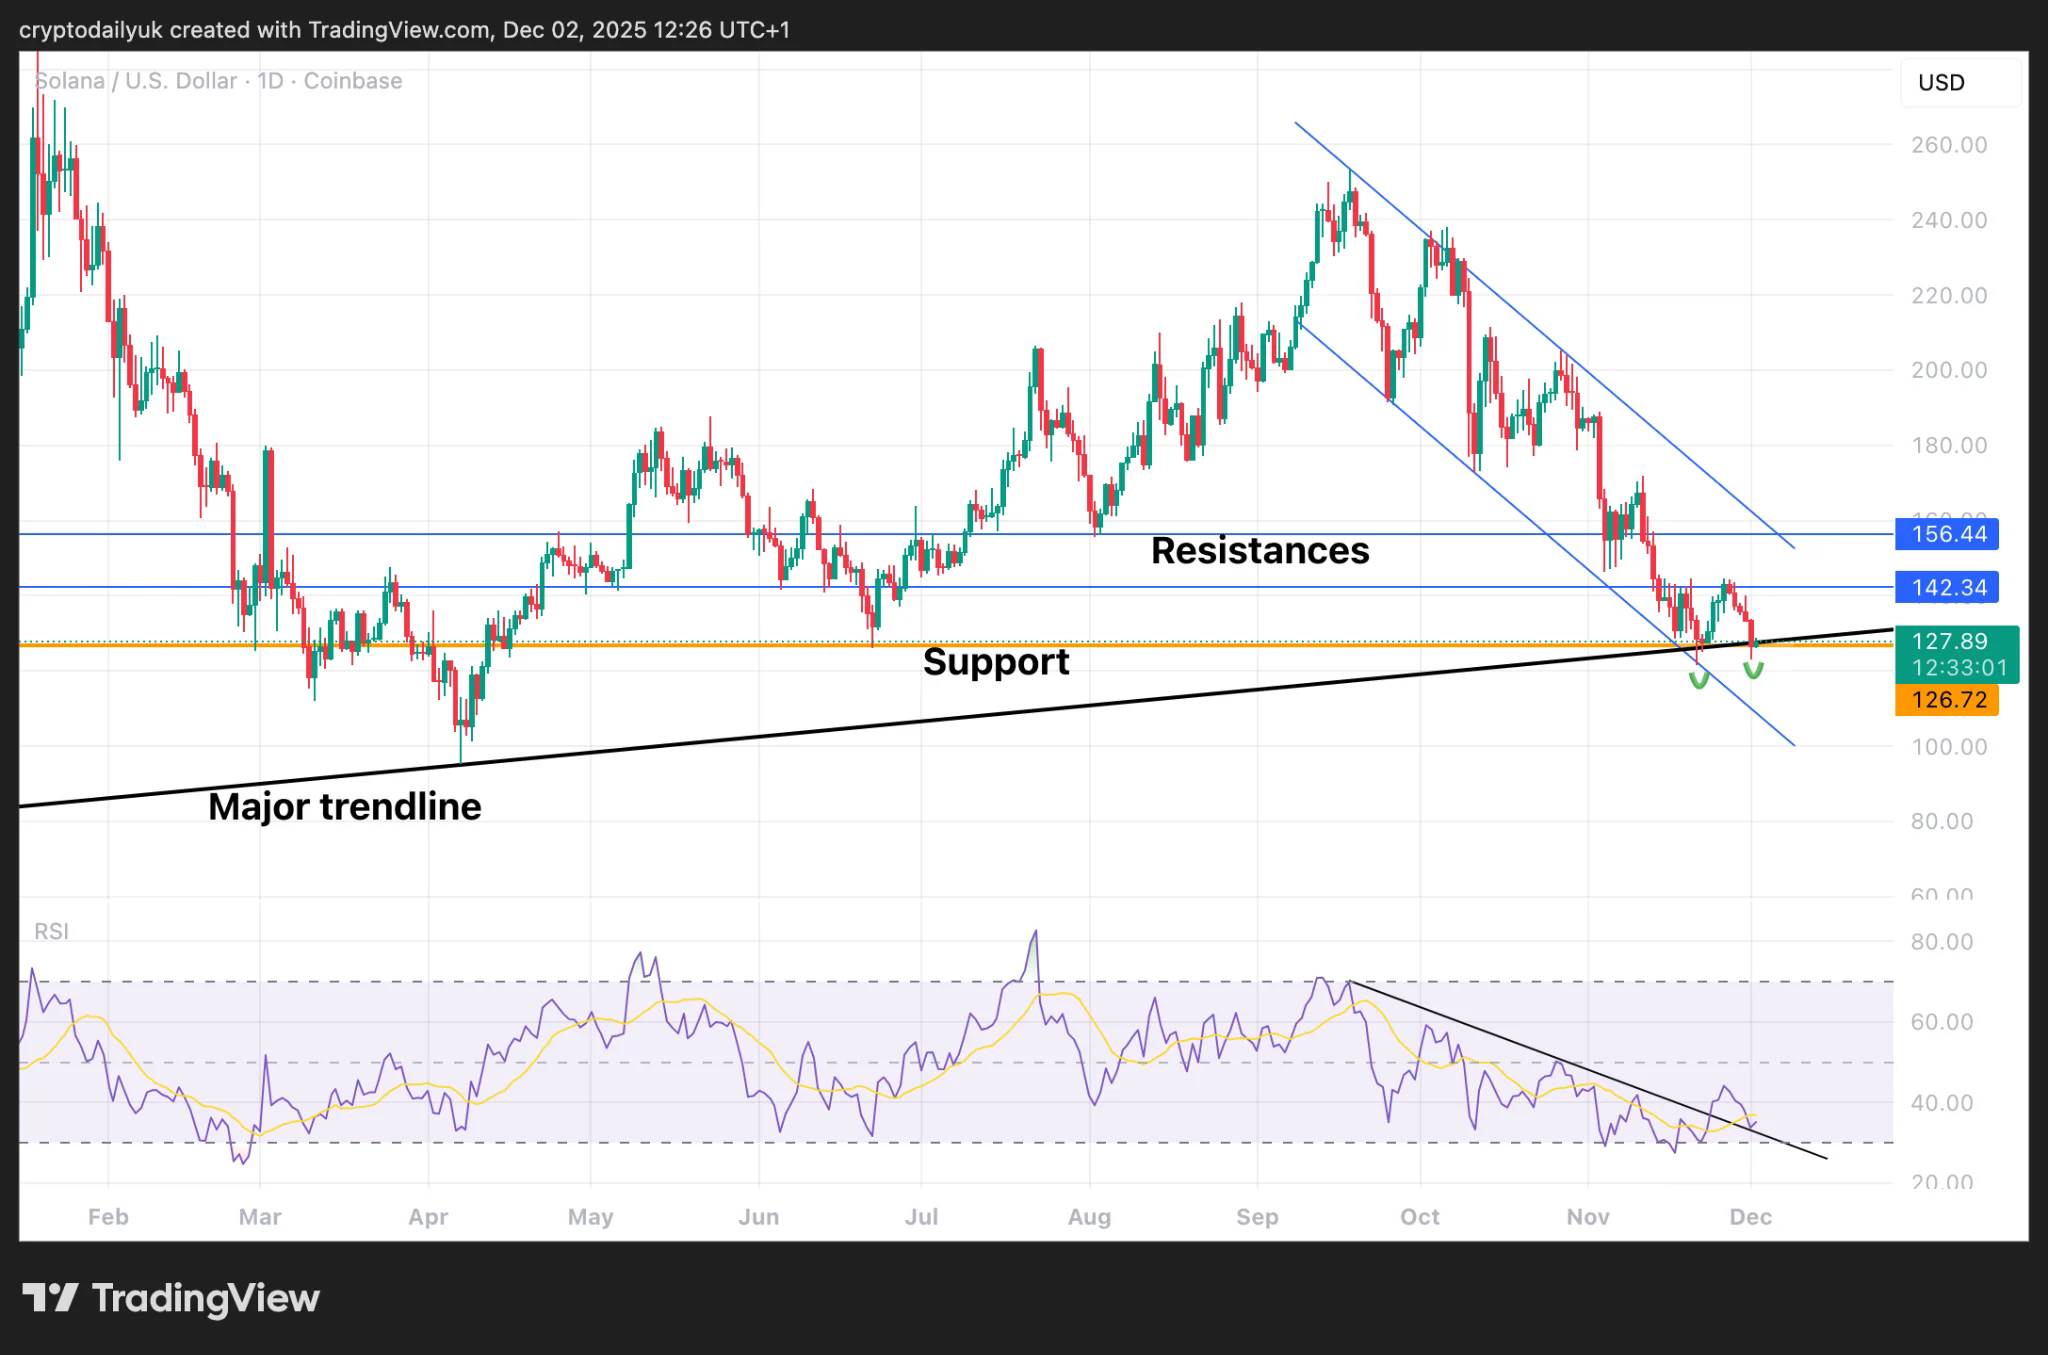
The daily chart provides a higher time frame perspective, allowing us to see what might happen if prices reach new lows.
Once ($SOL’s price manages to consolidate above these major support levels), the next targets would be: the resistance level at $142, the top of the downward channel, the horizontal resistance level at $156, followed by a higher peak at $172, which would confirm a change in trend.
From the bottom of the chart, it can be seen that the RSI indicator has broken through the downward trend line, and it is currently testing and confirming this breakout. If the breakout succeeds, prices are expected to continue rising.
$SOL’s weekly chart shows strong bullish signals.
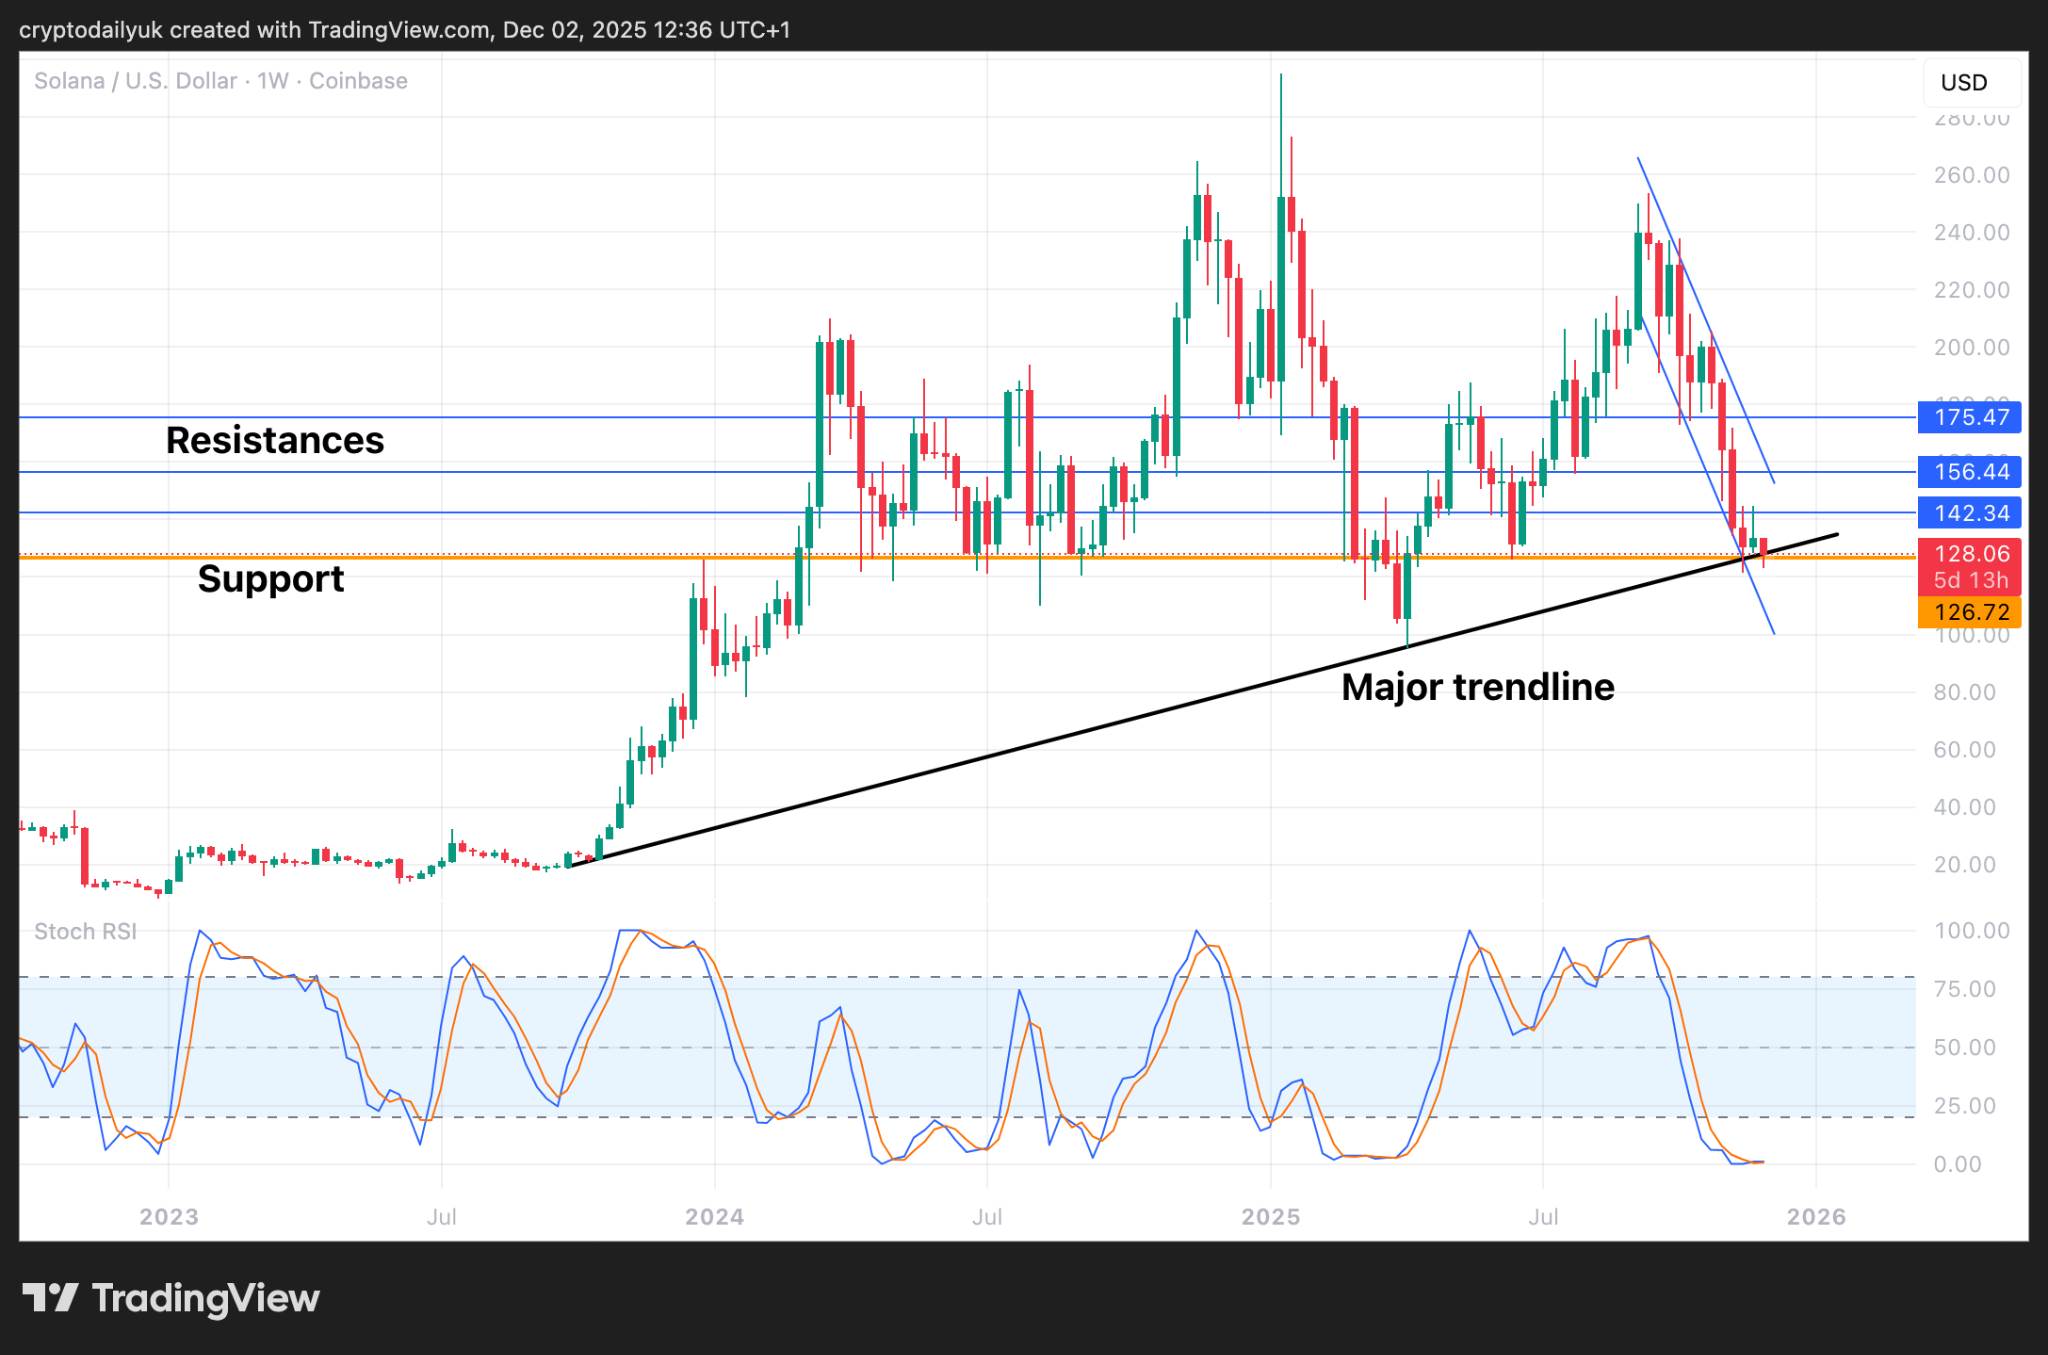
The weekly chart of SOL looks very promising. The support level at $126 is quite strong, and the price has reached this level while also crossing the main uptrend line. This strongly indicates that prices are likely to rebound significantly from here.
Looking at the Stochastic RSI indicator at the bottom of the chart, this trend is confirmed. The indicator shows that the line has touched bottom and is about to break above it.
Considering that the 2-week Stochastic RSI indicator is declining rapidly, and it may reach a low point in the coming week or so, significant upward momentum could arrive soon.
As mentioned earlier, if the price of SOL can reach a new high around $175, then the next target would be the macro high of $253. Please keep an eye on any potential significant increases in SOL’s price.