Exchange Ranking
 Top Exchanges
 24h Volume Ranking
 Popularity Ranking
 Exchange BTC Balance
 Proof of Reserves
 Decentralized Exchanges
 Funding Rate
 Funding Heatmap
 Liquidation Data
 Max Pain
 Long/Short Ratio
 Whale L/S Ratio
 Binance/Okex/Huobi L/S
 Bitfinex Margin L/S
 ETF Tracker
 Solana ETF
 XRP ETF
 Hong Kong ETF
 Bitcoin Treasuries
 Crypto Reversal
 Ethereum Reserves
 HyperLiquid Wallet Analysis
 Hyperliquid Whale Watch
 Large Transactions
 On-chain Movement
 Bitcoin ROI
 Stablecoin Market Cap
 Options Analysis
 News
 Articles
 Economic Calendar
 Features
 Wallet
 Contract Calculator


 Security
 Collections
 Watchlist
 Following
 BTC
The price of Bitcoin (BTC) is currently in a bearish flag pattern, and short-term momentum indicators suggest that prices may continue to decline. This means that Bitcoin is far from being out of danger, and it could even hit new lows. Traders should be cautious.
Will BTC encounter resistance?
Source: TradingView
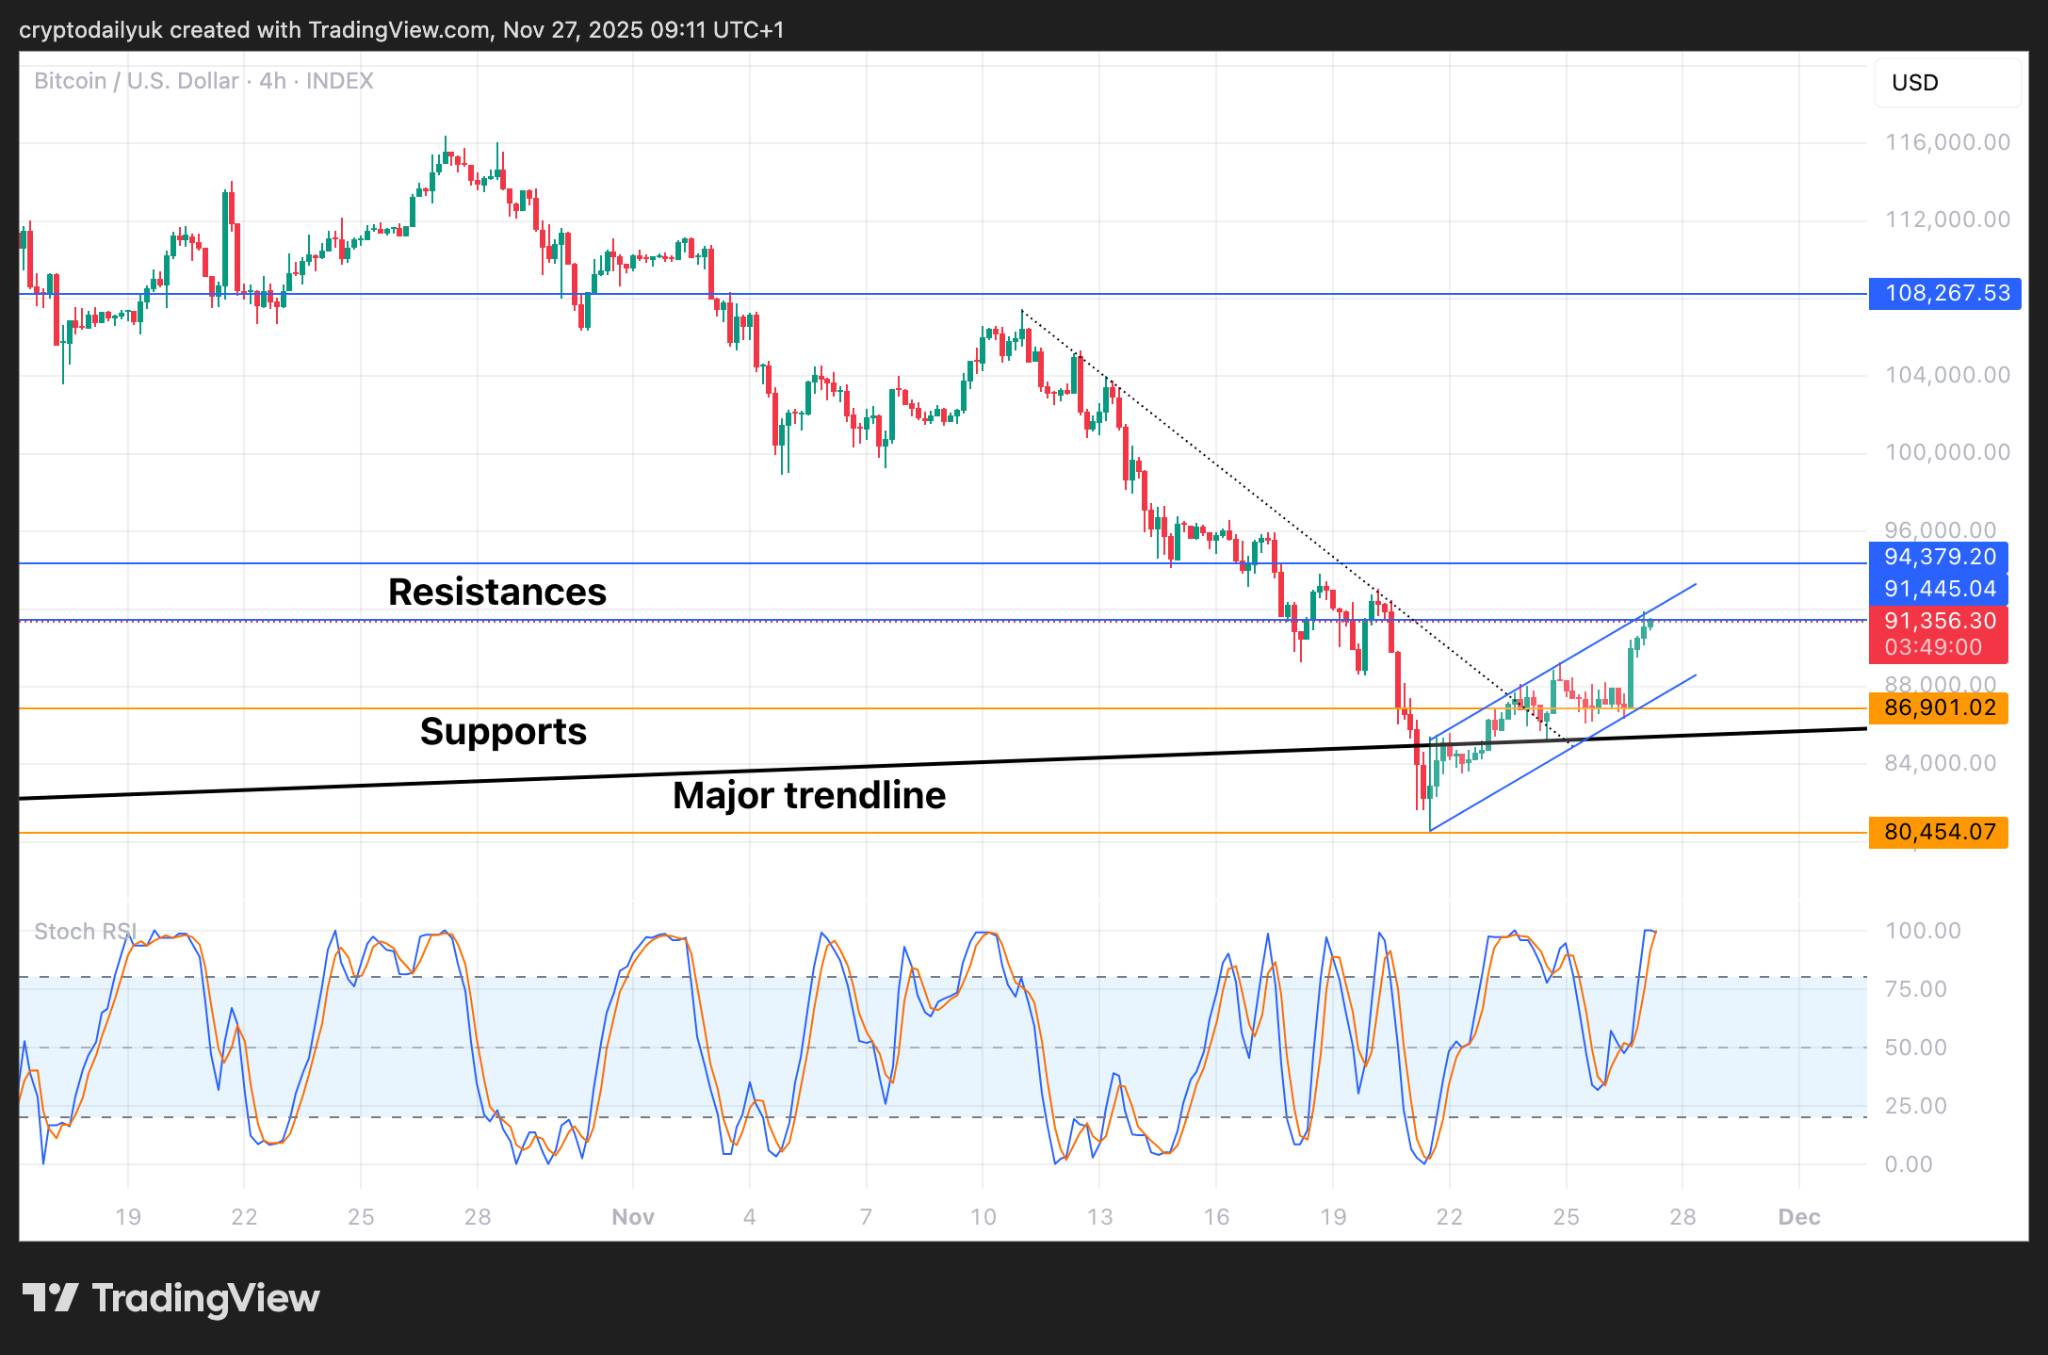
On the 4-hour chart, it can be seen that Bitcoin’s price is moving within a bearish flag pattern. After breaking through the downward trend line (indicated by the dotted lines), the price found support near the level of $87,000. The price then continued to move along this support level until it reached the bottom of the bearish flag pattern. Subsequently, the price rose almost all the way to its current level, having tested the top of the bearish flag pattern as well as the resistance level of $91,450. It is likely that the price will encounter resistance at this level.
Given that both the 4-hour, 8-hour, and 12-hour time frames, as well as the upcoming daily time frame, are overbought, it seems that another wave of correction is imminent.
If this does not happen and the price breaks through the horizontal resistance level, then the next resistance level, $94,400—which is also the top of the flag pattern—may determine whether the trend will reverse or not.
Will BTC return to confirming a crash?
Source: TradingView
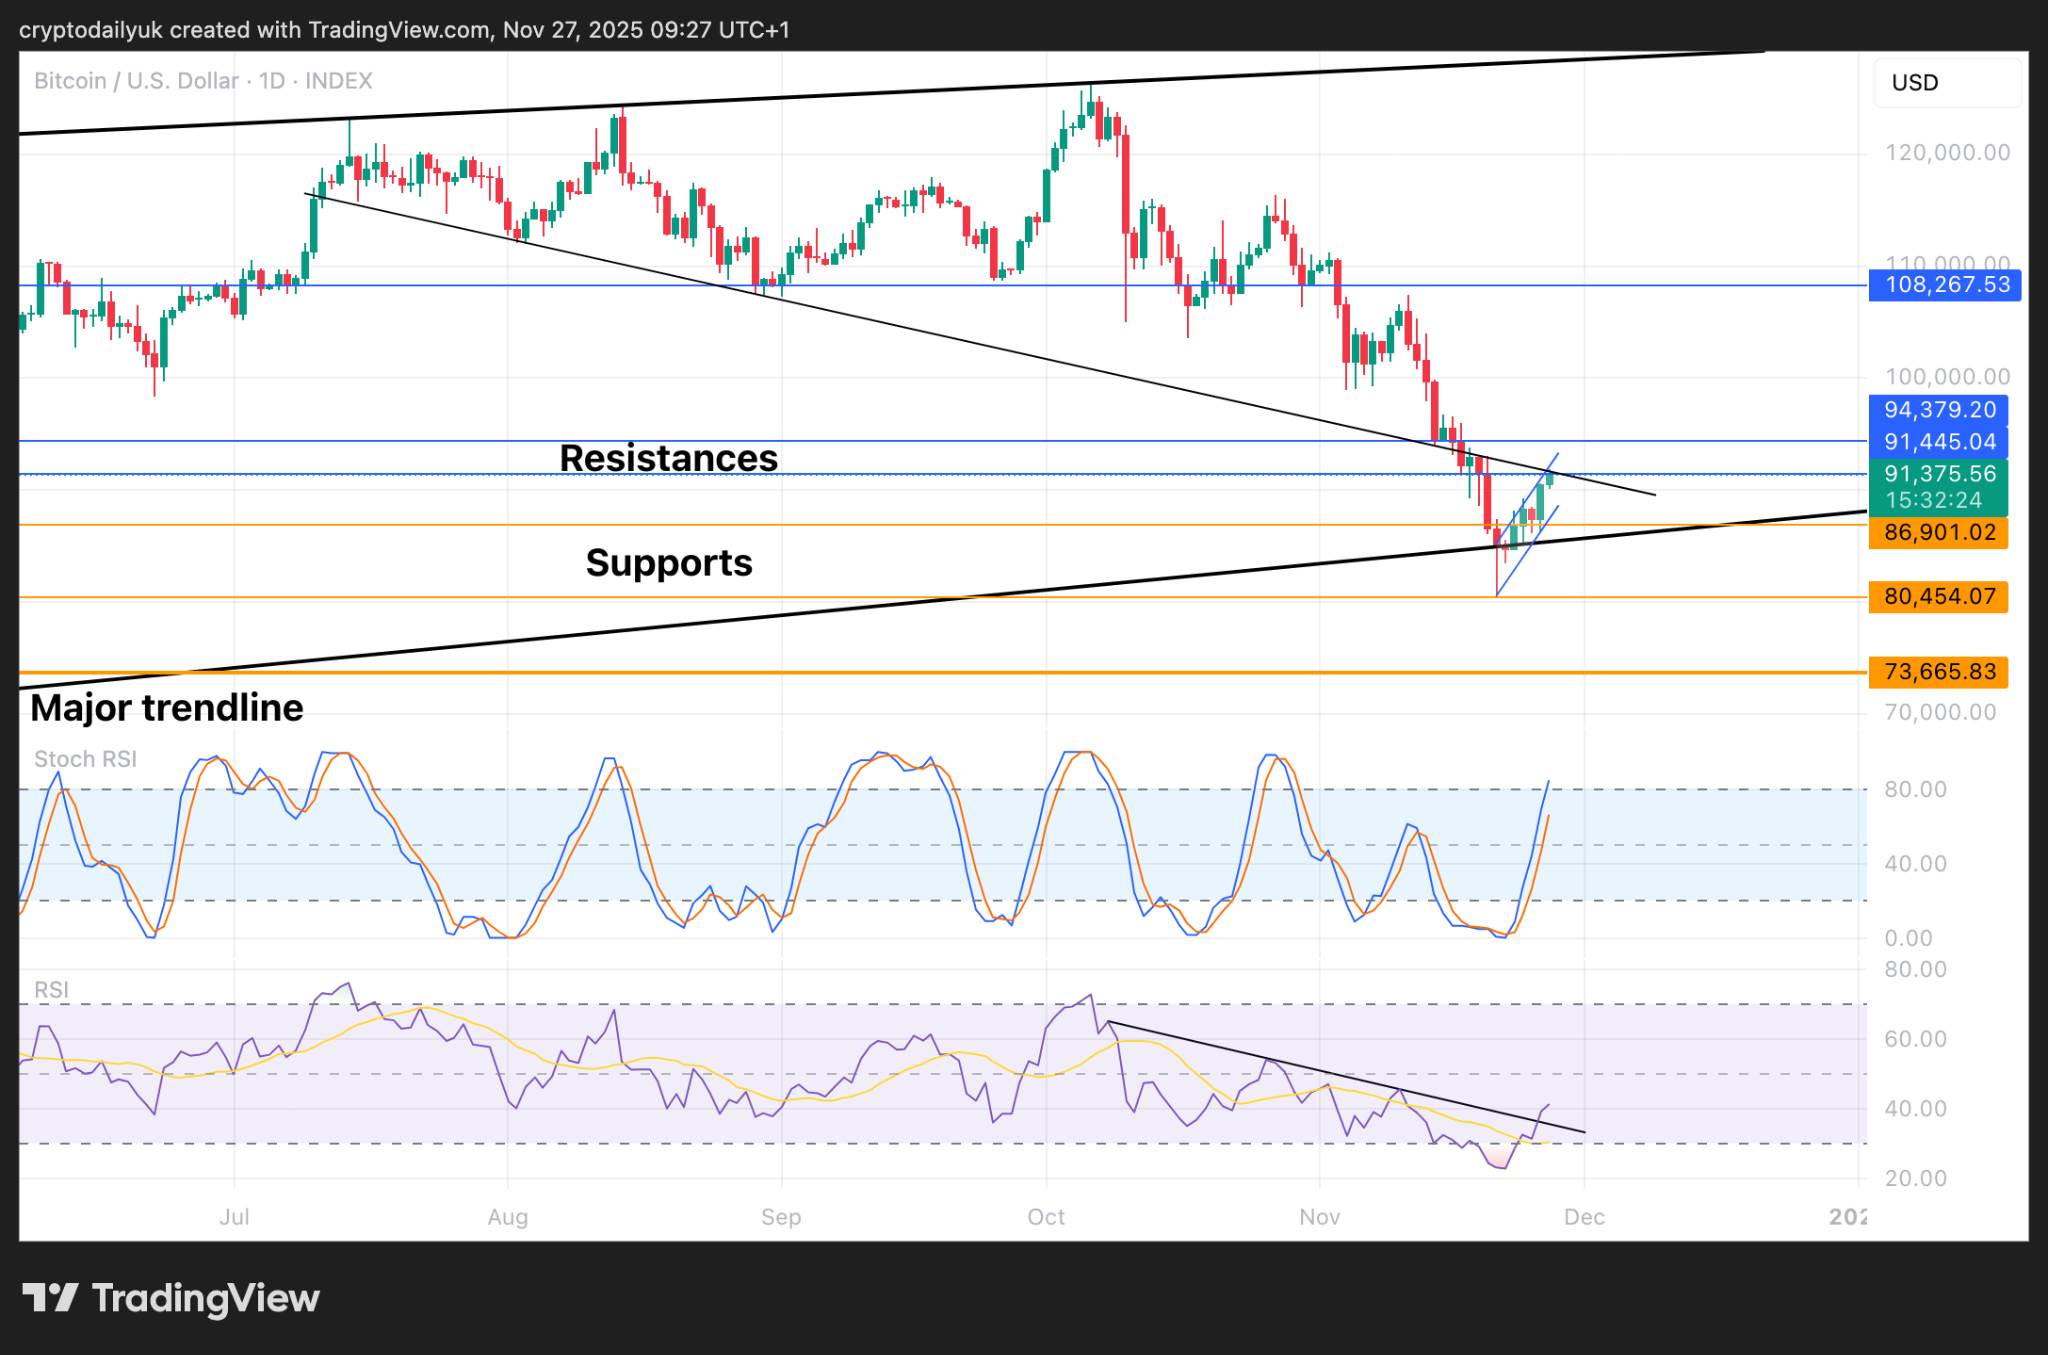
The daily chart shows that Bitcoin’s price encountered resistance at the downward trend line that began in July. The convergence of this trend line with the horizontal resistance level and the top of the bearish flag pattern, along with the peak of the short-term Stochastic RSI indicator, indicate that the price is about to reverse.
图表底部的一个利好因素是RSI指标已经突破了下降趋势线。预计该指标线将回落,重新测试突破点。
从长远来看,上涨仍然是最有可能的结果。
来源:TradingView
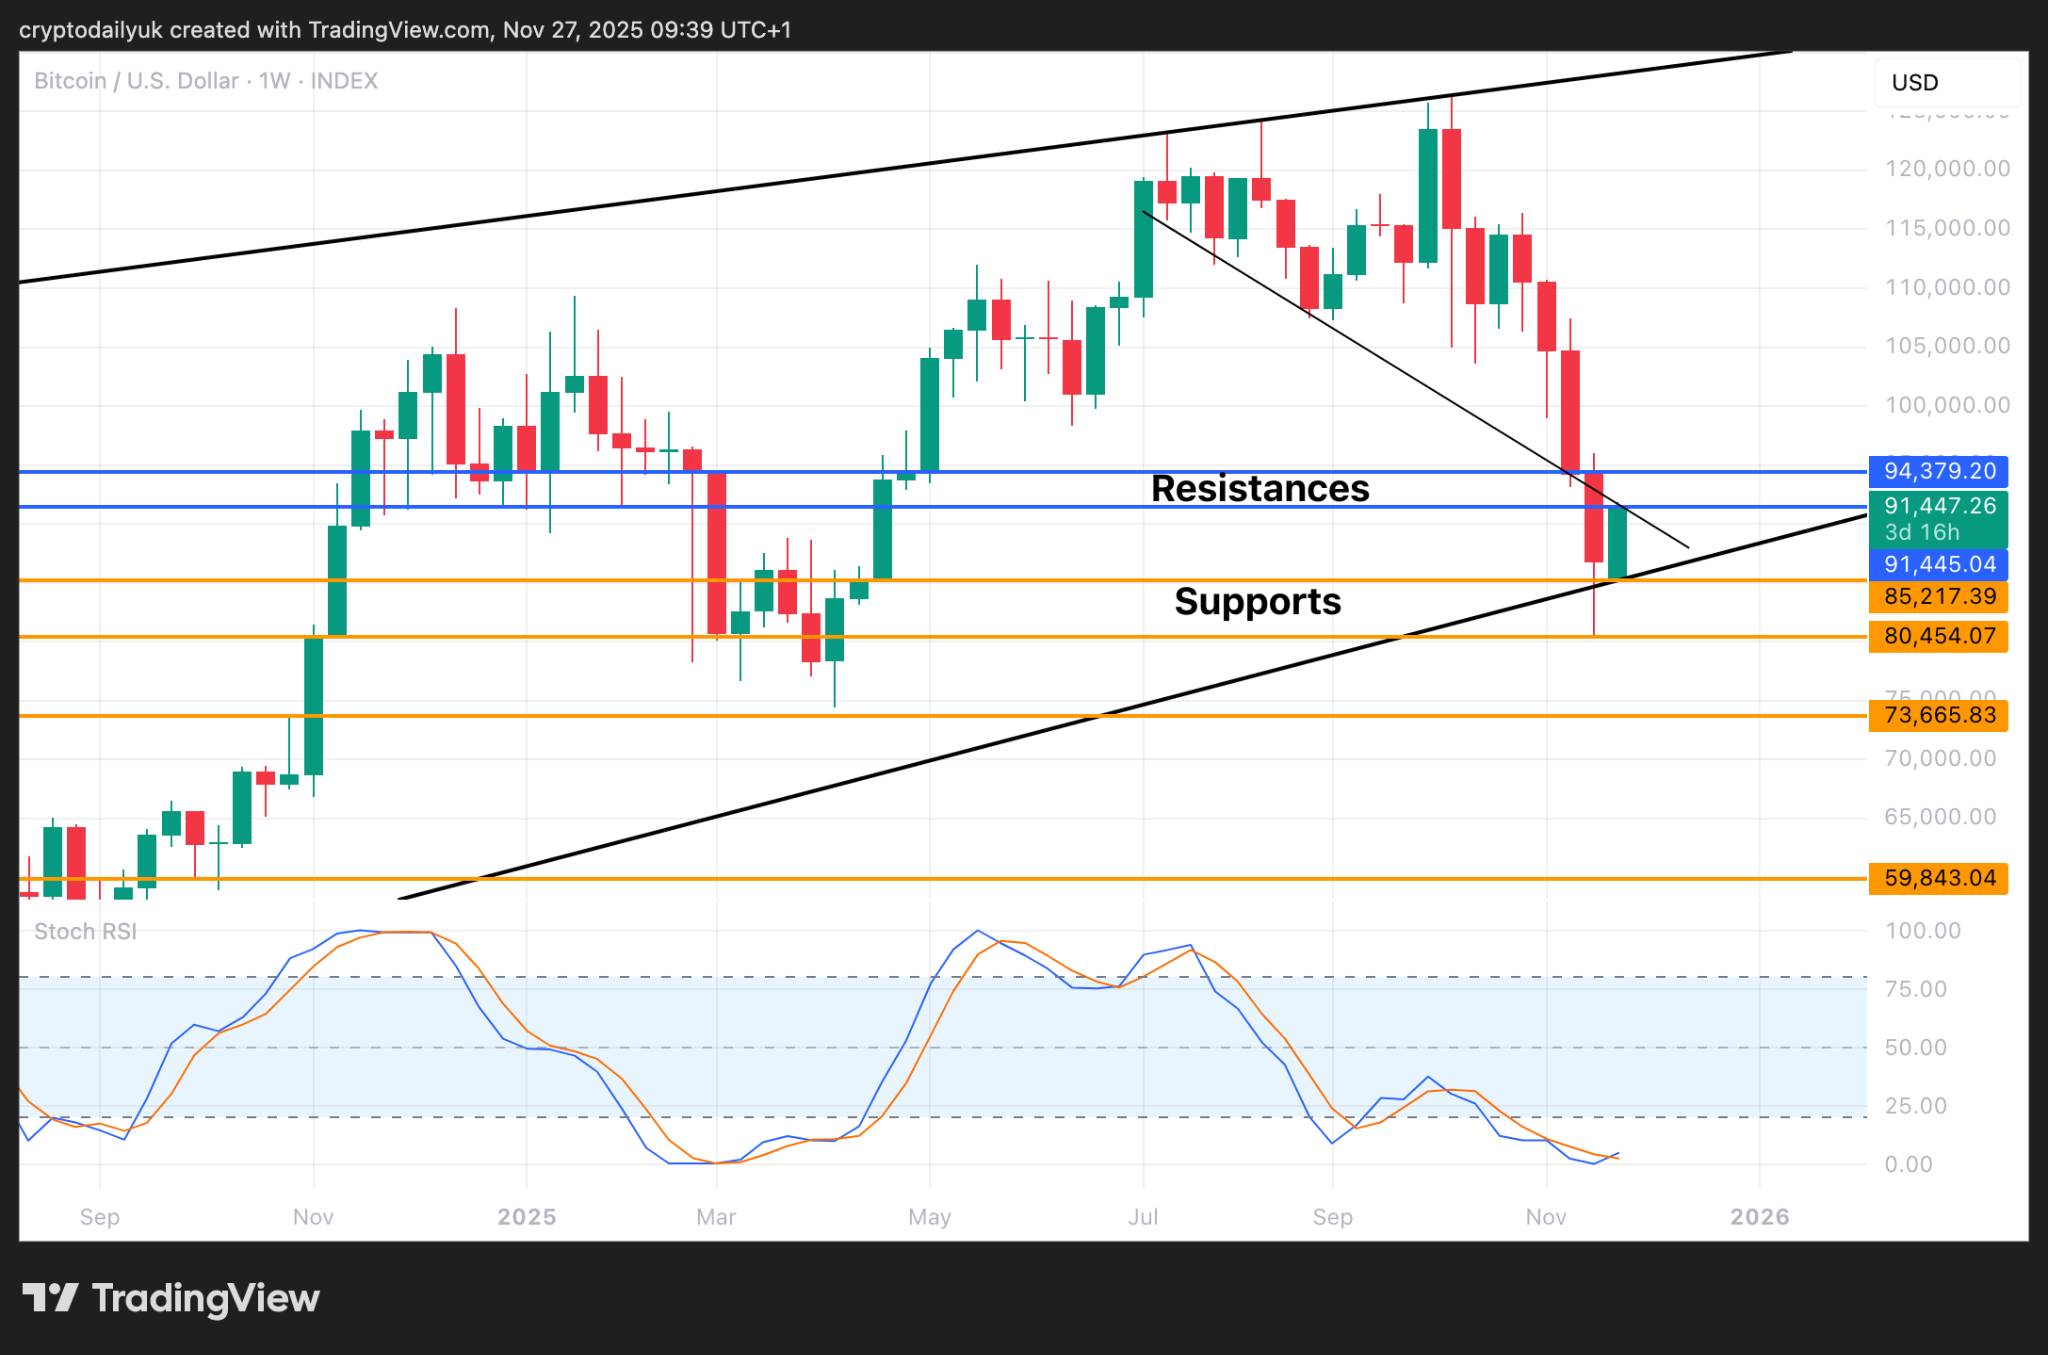
周线图显示,当前的绿色K线被下方的主要上升趋势线和上方的较短下降趋势线夹在中间。由于潜在的修正浪即将到来,这意味着可能还会有一根K线被夹在这个不断收窄的缺口中。
这两条趋势线之间的博弈很可能决定价格是飙升还是暴跌。如果美联储在12月降息(可能性很大),并且经济中没有出现黑天鹅事件,那么价格上涨的趋势仍然占优。