Exchange Ranking
 Top Exchanges
 24h Volume Ranking
 Popularity Ranking
 Exchange BTC Balance
 Proof of Reserves
 Decentralized Exchanges
 Funding Rate
 Funding Heatmap
 Liquidation Data
 Max Pain
 Long/Short Ratio
 Whale L/S Ratio
 Binance/Okex/Huobi L/S
 Bitfinex Margin L/S
 ETF Tracker
 Solana ETF
 XRP ETF
 Hong Kong ETF
 Bitcoin Treasuries
 Crypto Reversal
 Ethereum Reserves
 HyperLiquid Wallet Analysis
 Hyperliquid Whale Watch
 Large Transactions
 On-chain Movement
 Bitcoin ROI
 Stablecoin Market Cap
 Options Analysis
 News
 Articles
 Economic Calendar
 Features
 Wallet
 Contract Calculator


 Security
 Collections
 Watchlist
 Following
 XRP
XRP has been stuck below the middle band throughout this period, with every attempt to move upward failing. This has led to price accumulation, and there is a possibility of a 13% increase before Christmas. However, the chart still seems unsettling.

According to TradingView data, XRP’s price has declined recently, fluctuating between $2.10 and $2.20. But the real issue isn’t the candlestick chart itself. It remains trapped within the Bollinger Band range. This popular altcoin has been stuck below the middle band for nearly two weeks. This typically indicates that pressure is building below the current price level.
On paper, the price seems relatively stable. But the problem is that XRP’s price keeps hitting the same resistance levels near the middle band, and it stays stuck in that narrow range every time.
This behavior usually tells traders that the market isn’t refusing to rise, but it’s not yet ready to unleash its potential for growth. This pattern is very similar to the one seen before significant price increases, which is how the “13% Christmas rally” concept came about.
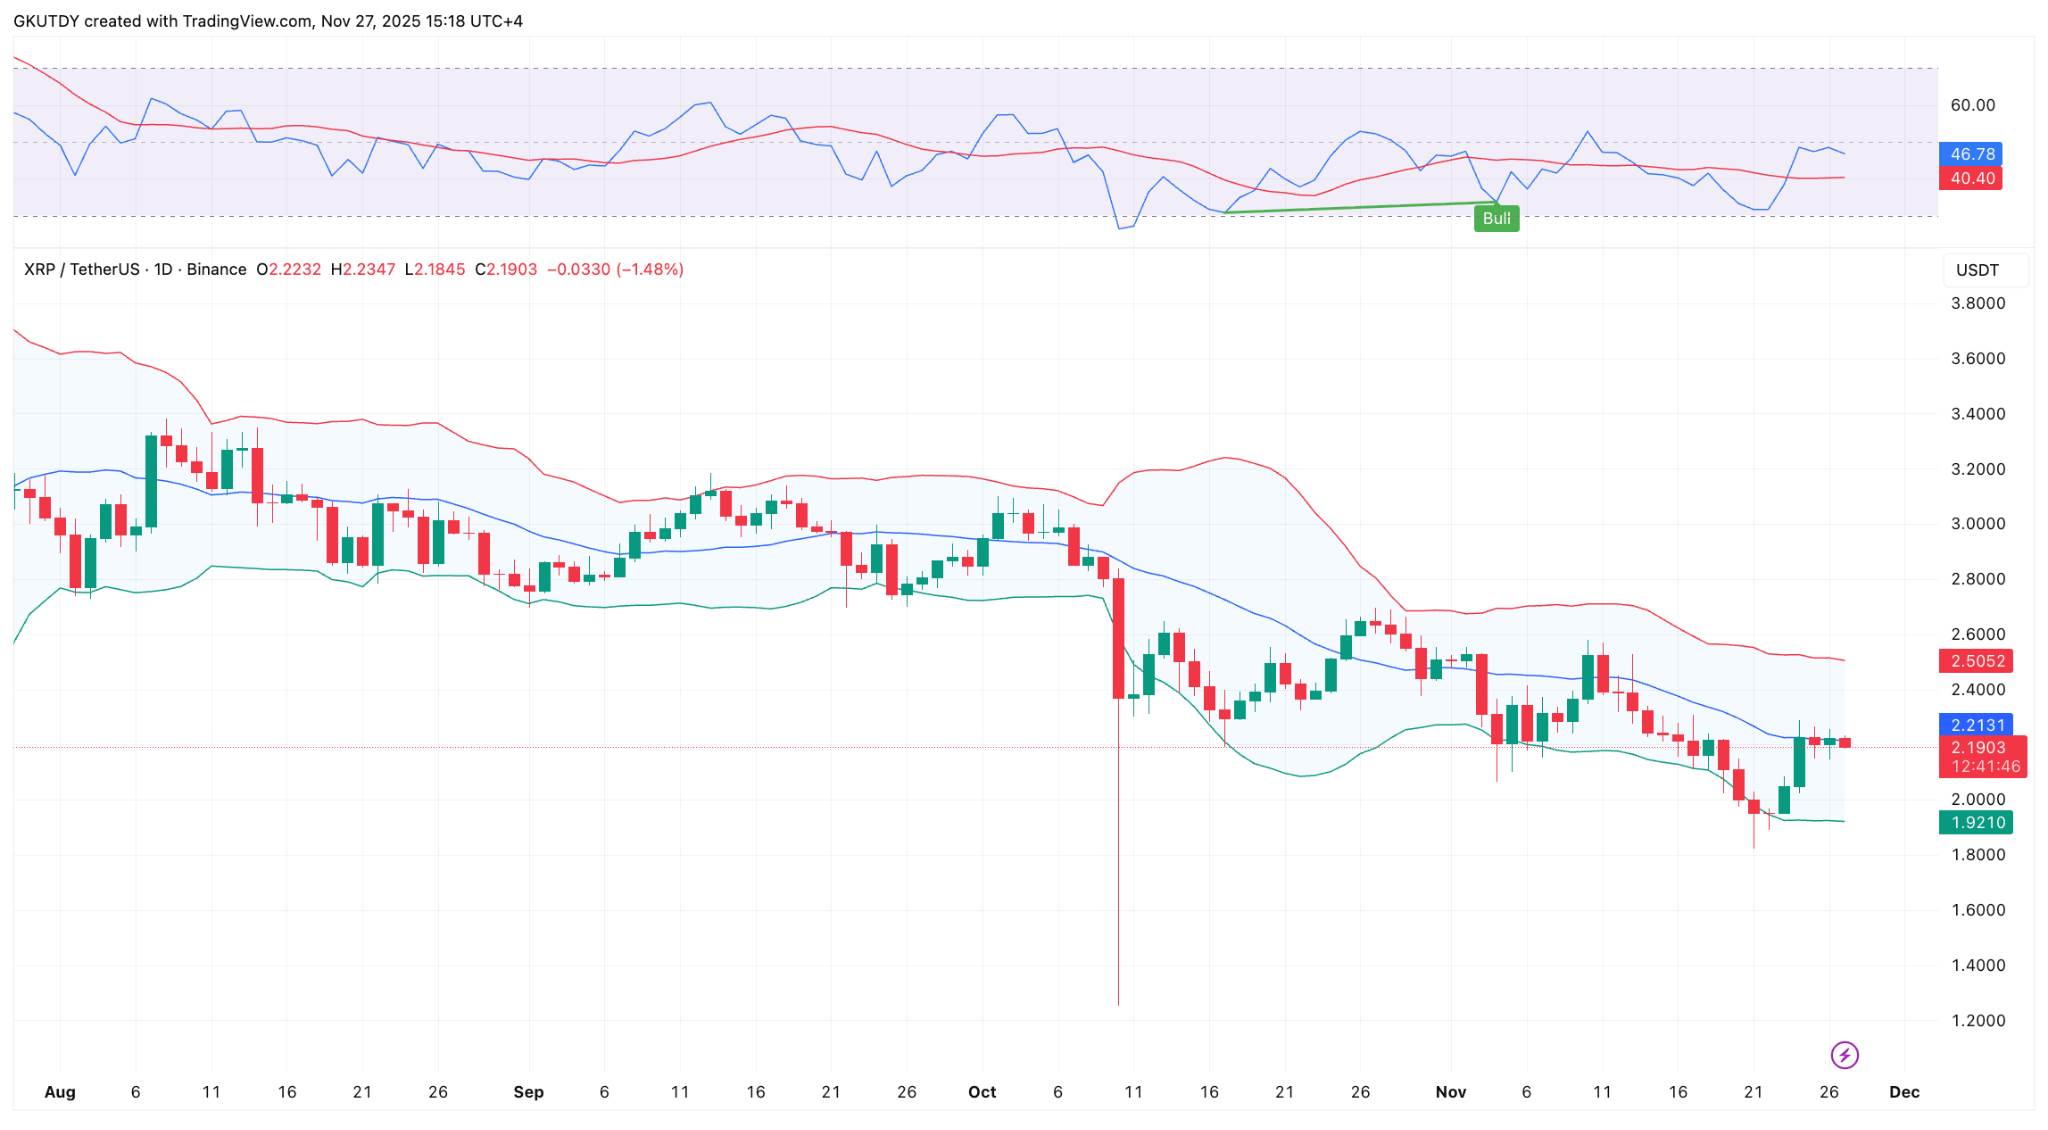
The price range of the XRP/USD pair provided by TradingView explains why this moment is so important. The upper band is close to $2.50, while the lower band is around $1.92. Since early November, XRP has been fluctuating without any clear direction between these two levels.