Exchange Ranking
 Top Exchanges
 24h Volume Ranking
 Popularity Ranking
 Exchange BTC Balance
 Proof of Reserves
 Decentralized Exchanges
 Funding Rate
 Funding Heatmap
 Liquidation Data
 Max Pain
 Long/Short Ratio
 Whale L/S Ratio
 Binance/Okex/Huobi L/S
 Bitfinex Margin L/S
 ETF Tracker
 Solana ETF
 XRP ETF
 Hong Kong ETF
 Bitcoin Treasuries
 Crypto Reversal
 Ethereum Reserves
 HyperLiquid Wallet Analysis
 Hyperliquid Whale Watch
 Large Transactions
 On-chain Movement
 Bitcoin ROI
 Stablecoin Market Cap
 Options Analysis
 News
News Articles
 Economic Calendar
 Features
 Wallet
 Contract Calculator


 Security
 Collections
 Watchlist
 Following
 BTC
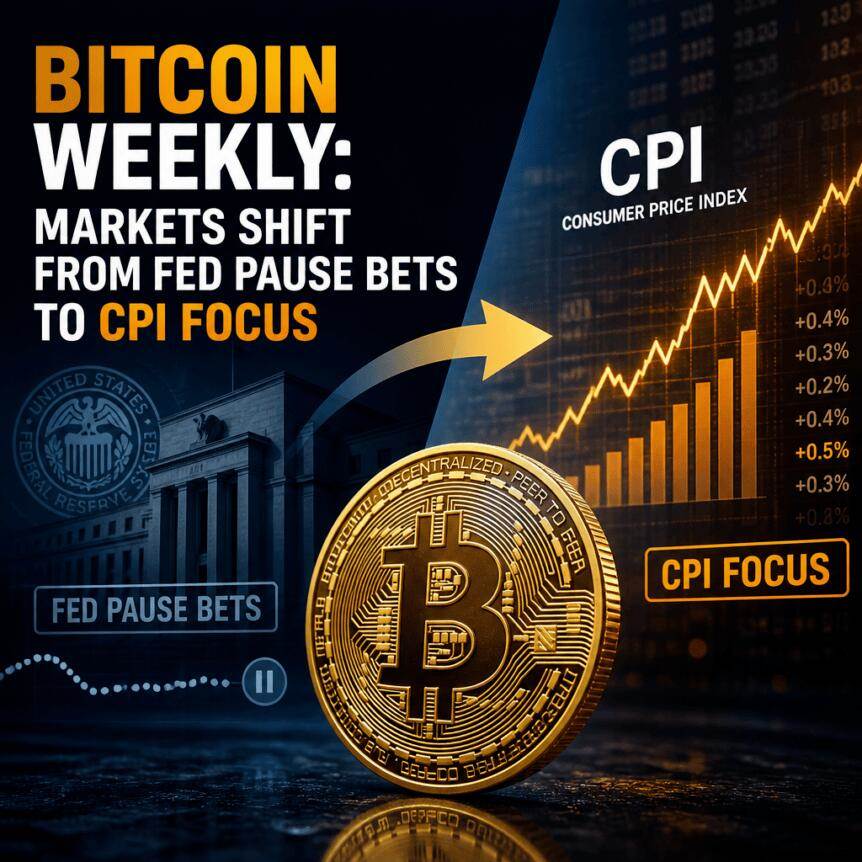
BTC Bitcoin Weekly: Market focus shifts from the Federal Reserve's suspension of interest rate hikes to CPI data
At the beginning of the week, Bitcoin prices climbed to an August high, and traders were digesting the latest U.S. inflation data and refocusing global interest rate expectations. As strong month-to-date gains push prices into the mid-range of $64,000, market participants are now focusing on holding key technical levels-especially ahead of CPI and PPI data, as volatility risks are rising.
At the same time, the macro background remains complex: the market is still recalibrating the Federal Reserve's policy path in 2026, and the yen has returned to the US$160 yen zone that the market is closely watching after recent U.S. intervention. The combination of macro drivers and on-chain positions is shaping an increasingly divided market debate between large and retail investors.
Key Points
U.S. CPI and PPI data will be released this week, after mixed but moderating inflation and labor signals have changed the probability of a rate hike. The yen is back approaching the 160 level after earlier intervention dynamics, which traders have linked to broader liquidity of risky assets. The core area of focus for Bitcoin bulls is $65,800, which is the focus of multiple traders and clearing data based on order books. CryptoQuant data shows that the accumulation of large Bitcoin wallets (holding addresses exceeding 10,000 BTC) has reached multi-month highs. Despite the local strength,"cyclical" indicators on the chain suggest that the bear market phase may not be over yet-especially in the second half of 2026.
Inflation data and Federal Reserve's tightening/pause considerations
Market attention this week was focused on the release schedules of consumer prices and producer prices. The July CPI will be released on Wednesday and the July PPI will be released on Thursday. These key data often change the market's expectations for the Fed's future interest rate path. Recent inflation signals have been uneven, and new data releases are accompanied by additional uncertainties related to the U.S. -Iran conflict. Oil prices remain sensitive to developments in the Strait of Hormuz, and this risk may be passed on to CPI through deterioration or restoration of shipping conditions. A market analyst said crude oil was still "trapped between opposing forces" and the market was weighing the possibility of a breakthrough in the Strait issue against Iran's proposed recovery conditions.
In addition to oil prices, traders 'immediate background is the direction of previous macro data in the United States. CPI and PPI results unexpectedly fell last month, with CPI recording its largest monthly decline since April 2020. Labor market data also added a cooling tone: non-farm payrolls data fell short of expectations, indicating a weaker-than-expected labor situation and a rising possibility that the Fed may be more dovish. These changes have had an impact on interest rate pricing. According to CME Group's FedWatch tool, as of Monday, there is a 56% chance that the Federal Reserve will suspend interest rates at its September 16 meeting, while market pricing has been more inclined to raise interest rates. An investment company wrote in its latest newsletter that a week ago, the implied probability was leaning towards a September rate hike, but now pricing is "slightly leaning towards the Federal Reserve keeping interest rates unchanged." It is expected that there will be only one more rate hike before suspending interest rates and continuing until next year.
Japanese yen dynamics return to risk asset discussion center
While U.S. data drives part of the narrative, traders are also focusing on currency flows that could change liquidity in global markets. The yen remains a focus after a rare joint U.S. -Japanese intervention. After the dollar/yen fell to its lowest level since 1986 in early August, the New York Fed used euros to buy yen on behalf of the U.S. Treasury through the Exchange Stability Fund. The U.S. Treasury secretary said at the time that further intervention was possible and said the United States strongly supported Japan's efforts to correct what it called a "significant undervaluation" of the yen. In the following days, the yen was mixed. The yen initially strengthened to around 156 yen against the U.S. dollar, but then weakened again and rebounded above 158.50, gradually approaching the key 160 level. One researcher warned that intervention mechanisms alone may not be able to reverse underlying trends. He compared the effect of this action with the dynamics of "exchange rate checks" before and after Japan's February 8 election, arguing that price movements did not show a meaningful reversal, and suggested that the intervention was unlikely to stop the yen's depreciation trend.
Earlier reports also pointed out how the yen carry trade affects the liquidity of cryptocurrencies and other risky assets. Some analysts stressed that the bigger question is whether rising Japanese yields will change investors 'motivations to allocate capital overseas.
Bitcoin technical focus shifts to US$65,800, traders focus on liquidity
Bitcoin's price trend this week is determined by breaking expectations and the widely watched moving average resistance. Entering Sunday's weekly close, Bitcoin prices hit an intra-month high of about US$65,420, and then consolidated when the traditional market opened. Data shows that BTC/USD is still fluctuating within a range, with the 50-month index moving average around US$65,827 constituting upper resistance. Despite this, some traders believe that based on traditional momentum indicators, three breakthrough signals are taking shape. He reported "strong" bullish divergences in both MACD and RSI on the three-day and one-week time frames-a way to seek confirmation signals even when prices are temporarily stagnant. In this trader's framework, the critical line is $65,800. He believes that if the weekly level of $65,800 is broken, it may trigger "sharp upward fluctuations" as short liquidity is forced to leave after consolidation. In addition, clearing data based on order books also highlights $65,800 as a key area where clearing could cluster if prices turned decisively. At the time of reporting, short liquidations in cryptocurrencies in the past 24 hours totaled $53 million, indicating that although the market is not in a full-scale expansion stage, traders have sufficient positions to provide feedback on fluctuations near key levels.
Other technical reviews pointed to a declining wedge pattern on the daily chart and described a possible "decision window" before August 17. He envisions several scenarios: if prices block between US$66.4K and US$66.8K and then form a higher low, possibly building a rising triangle; if prices fall back into a wedge, it will weaken the bullish pattern; a break below support will invalidate the bullish pattern. As an upside possibility, he mentioned $72,000 as a "possible scenario."
On-chain signals: The accumulation of large wallets has increased, and the decrease of small households
The most positive on-chain development comes from the increasingly active activity of large Bitcoin investors. CryptoQuant's analysis points out that addresses holding more than 10,000 BTC are clearly turning towards accumulation. On a 60-day rolling basis, the group's open balance increased by 46,420 BTC on August 9, which CryptoQuant described as the largest increase since March 15. CryptoQuant also emphasized that the latest reading is almost double the peak of 23,238 BTC accumulation recorded in mid-March. In other words, the acceleration not only continues, but also intensifies. Equally important, CryptoQuant describes the divergence between large holders and small addresses. During the same 60-day window ending August 9, wallets holding 0.1 BTC to 1 BTC distributed approximately 9,700 BTC after accumulating in July. This means that large holders are increasing exposure and smaller participants are reducing positions, and this divergence of positions is important because it affects the speed at which demand absorbs selling pressure when prices test lower support.
This week's cumulative narrative also fits into the broader context of participation concerns. Earlier observations pointed to strong accumulation between US$62,000 and US$65,000, as well as discussions about the order book and market structure. Another analyst added another perspective: He described the spot market as "almost dead", pointing to a daily spot turnover rate of 0.32%(the lowest level in his data) and a year-on-year decline in dollar trading volume of about 64%.
Cyclical indicators still warn that the bear market may not be over yet
Even with accumulated data and bullish divergences on short-term charts, some analysts still believe the market is in late-stage bear market mode. One analyst discussed a record period of "surrender" in a basket of 45 indicators tracked by specific indicators. In his description, the market is in its coldest phase since the FTX crash-late in the bear market cycle, but has not yet reached the clearest "deep blue" phase that has marked the bottom in the past. Another data source provides a similar framework through its compilation of peak bull cycle indicators, which shows that the market is 32% away from the ideal "sell" zone. Taken together, these views suggest that while selective accumulation and liquidity dynamics may support short-term upside attempts, confirmation of structural reversals may still require broader participation than spot indicators currently indicate.
One trader and analyst added a historical perspective by comparing the current chart structure to the 2022 bear market. He believes that Bitcoin is reaching lower highs than the upper shadow line in July 2022, and in that early cycle, August produced a higher highs. He also reiterated that Bitcoin has not yet regained its 50-month exponential moving average (approximately $65,827), a technical factor that usually heralds a deeper bear market capitulation phase.
For traders and investors, the next decision points may converge: how CPI and PPI will change Fed expectations; whether the yen's approach to 160 will change global liquidity incentives; and whether Bitcoin can turn $65,800 into confirmed support rather than another range boundary. Attention needs to be paid to whether on-chain accumulation will expand with spot activity, or whether the market continues to show strength dominated by a few large holders.