Exchange Ranking
 Top Exchanges
 24h Volume Ranking
 Popularity Ranking
 Exchange BTC Balance
 Proof of Reserves
 Decentralized Exchanges
 Funding Rate
 Funding Heatmap
 Liquidation Data
 Max Pain
 Long/Short Ratio
 Whale L/S Ratio
 Binance/Okex/Huobi L/S
 Bitfinex Margin L/S
 ETF Tracker
 Solana ETF
 XRP ETF
 Hong Kong ETF
 Bitcoin Treasuries
 Crypto Reversal
 Ethereum Reserves
 HyperLiquid Wallet Analysis
 Hyperliquid Whale Watch
 Large Transactions
 On-chain Movement
 Bitcoin ROI
 Stablecoin Market Cap
 Options Analysis
 News
News Articles
 Economic Calendar
 Features
 Wallet
 Contract Calculator


 Security
 Collections
 Watchlist
 Following
 HBAR
HBAR Hedera Price Forecast: Analysis of HBAR Breakthrough Prospects
Hedera (hash diagram) finally achieved success after two failed attempts, and market attention rebounded again. There are some changes on the 4-hour chart this time, which can only be clearly seen by comparing the price's response to each attempt with its performance at the time of final success. Today's news from Hedera tells the same story, adding weight to this chart pattern that has lasted for weeks. The following is a complete market overview.
Hedera's Price Today: Real-time HBAR Data and 24-Hour Changes
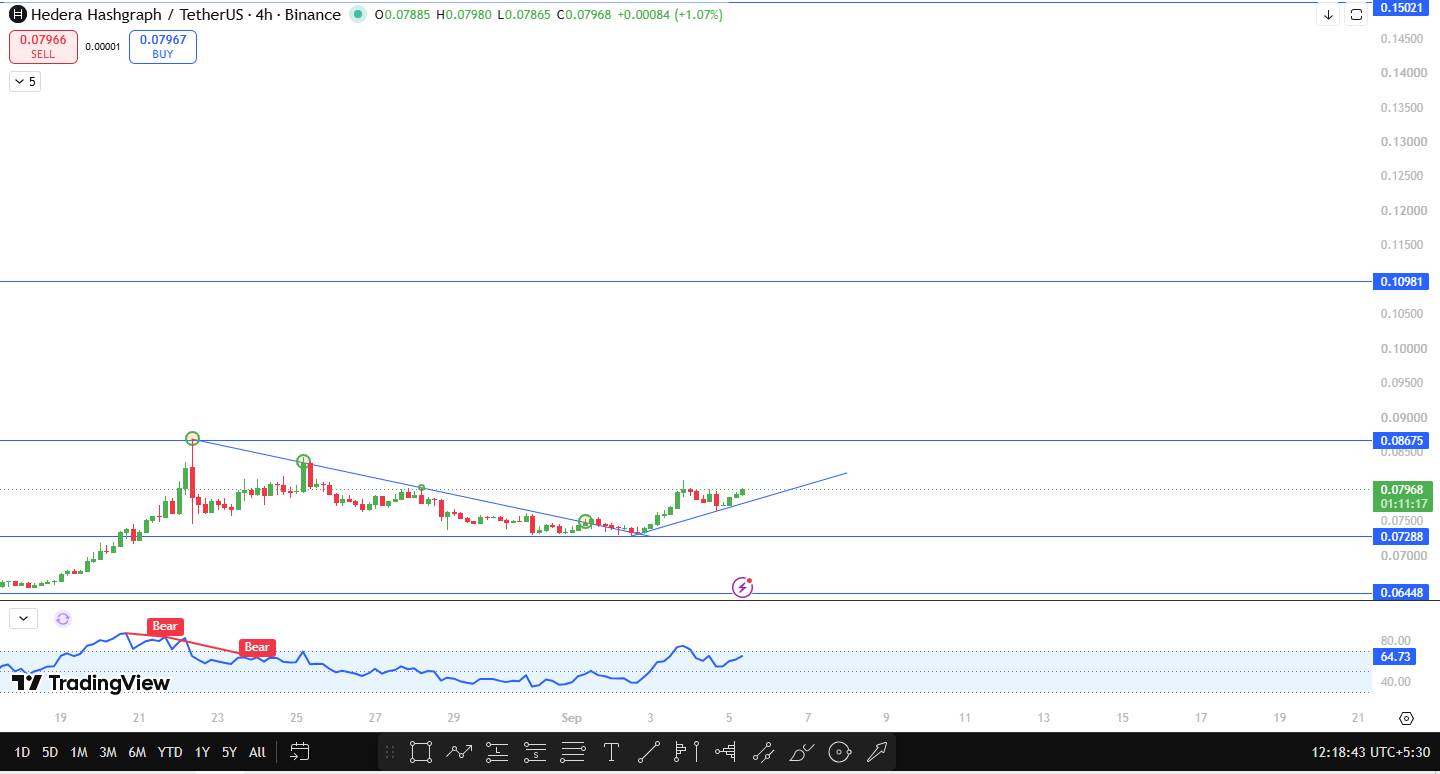
As of the time this snapshot was taken, Hedera's trading price was US$0.07967, an increase of 2.32% within the day and an increase of approximately US$0.0018 in the past 24 hours. Futures volume on exchanges was US$87.05 million, while spot volume was US$28.22 million, indicating that derivatives traders now have a greater influence on HBAR's short-term price movements than the spot market. Open interest positions remained at a moderate level of US$119.13 million. If this breakthrough gains momentum, there will still be room for new positions. Hedera has a market value of US$3.49 billion, a circulating supply of 43.83 billion HBAR, and a total supply and maximum supply of 50 billion tokens.
Today's Hedera News: On-chain activity rises significantly
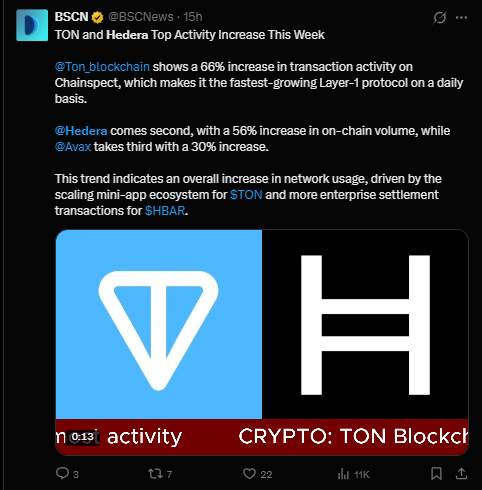 The latest Hedera news directly reflects what is shown on the chart. According to BSCN, Hedera's on-chain transaction volume increased by 56% this week, second only to the Ton blockchain (Ton's transaction activity increased by 66% in Chaininspect data and is currently rated as the fastest-growing Layer-1 protocol per day). Avalanche ranked third with a growth rate of 30%. BSCN attributes this broader trend to an overall increase in network usage, with Ton's growth driven by its expanded mini app ecosystem, and Hedera's growth more related to corporate settlement transactions, a detail that is in line with Hedera's long-standing enterprise-level positioning.
For anyone who follows both Hedera's latest news and chart trends, this kind of on-chain growth is the backdrop for this breakthrough attempt.
 Hedera Technical Forecast: HBAR Price Outlook and Breakthrough Levels
On the 4-hour chart,$HBAR fell for several weeks along the downtrend line, and was rejected during the previous two retests of the trend line. However, the third retest told a different story. Rather than being rejected again, prices stabilized around that level and eventually broke through it, confirming that the downward trend that has been suppressing HBAR since late August has been broken. Since then, prices have climbed along a new uptrend line, using it as a support level, which is the core content of HBAR's technical analysis.
The close of the next four-hour cycle will determine how far the market stretches. A close above $0.08675 would confirm that the breakthrough is truly sustainable, opening the path to $0.10981, which is approximately 37.8% higher than the current HBAR price. Beyond this level, US$0.15021 becomes the next major resistance level and long-term HBAR price target, nearly 88.5% higher than $HBAR's trading day today, a level that $HBAR has not approached for some time.
We still need to respect the other side of the HBAR price outlook. If the price closes below $0.07288 (approximately 8.5% below the current price), it will be confirmed that the new uptrend line has expired and the recent breakout has been reversed. In this case, the next support level to watch out for is at $0.06448, about 19.1% below current levels and close to the area HBAR built before this entire recovery attempt began.
For now, a successful third retest and a move into the uptrend line have dominated the bullish breakout scenario, but the next close on either side of $0.08675 will confirm the direction of HBAR's actual commitments.
HBAR support and resistance levels set this time
Resistance level 2 (main): US$0.15021 (+88.5%)
Resistance Level 1: 0.10981 USD (+37.8%)
Breakthrough Trigger: 0.08675 USD (+8.9%)
Current Price (CMP): 0.07968 USD-
Breakthrough Trigger: $0.07288 (-8.5%)
Support 1: US$0.06448 (-19.1%)
HBAR's forecast bull, benchmark and bear market scenarios
Bull market scenarios: $HBAR adheres to the new uptrend line, pushing the four-hour cycle closing price above US$0.08675, and leveraging the momentum brought by growing on-chain activity and corporate settlement growth to move towards the US$0.10981 and even US$0.15021 area.
Baseline scenario: $HBAR consolidates below $0.08675 for a while, testing this resistance level once or twice without a decisive breakthrough, essentially allowing breakthrough attempts to build more confidence before further commitments.
Bear market scenario: If sellers force the 4-hour cycle close below $0.07288, which will completely offset the recent trend line break, HBAR could slip back into the support area of $0.06448 as recovery attempts lose their foothold.
Hedera risks to be concerned about
Breakthroughs for HBAR are still fresh, and new breakthroughs in lower time frames can occur quickly and fail equally quickly, so it is crucial to view $0.08675 as a confirmation level rather than a guarantee. The increase in on-chain activity mentioned in the latest Hedera news is a truly positive sign, but network usage data does not always translate directly into continued price strength, especially as broader crypto market sentiment turns to risk aversion. No matter how perfect the chart shape looks, overall market volatility and any correction in the broader Layer-1 sector could also have a negative impact on this HBAR price outlook.
Hedera Glossary
Downtrend Line: A line formed by connecting a series of falling highs serves as dynamic resistance during a downward trend in prices.
Trend Line Breakthrough: The closing price crossed the previously respected trend line, indicating a possible reversal of previous trends.
Open interest: The total number of derivative contracts that have not yet been settled, a measure of active leveraged positions.
On-chain transaction volume: A measure of transaction activity occurring directly on the blockchain network, often used as a proxy indicator of real use and adoption.
Disclaimer :This article is for reference only and does not constitute financial, investment or trading advice. The cryptocurrency market is extremely volatile, and price forecasts are based on technical analysis and may change rapidly as new market data emerge. Before making an investment decision, be sure to conduct independent research and consult a qualified financial adviser.