Exchange Ranking
 Top Exchanges
 24h Volume Ranking
 Popularity Ranking
 Exchange BTC Balance
 Proof of Reserves
 Decentralized Exchanges
 Funding Rate
 Funding Heatmap
 Liquidation Data
 Max Pain
 Long/Short Ratio
 Whale L/S Ratio
 Binance/Okex/Huobi L/S
 Bitfinex Margin L/S
 ETF Tracker
 Solana ETF
 XRP ETF
 Hong Kong ETF
 Bitcoin Treasuries
 Crypto Reversal
 Ethereum Reserves
 HyperLiquid Wallet Analysis
 Hyperliquid Whale Watch
 Large Transactions
 On-chain Movement
 Bitcoin ROI
 Stablecoin Market Cap
 Options Analysis
 News
News Articles
 Economic Calendar
 Features
 Wallet
 Contract Calculator


 Security
 Collections
 Watchlist
 Following
 TRUMP
TRUMP TRUMP Official Price Forecast: Technical Analysis and Market Outlook
TRUMP's price forecast must start from what just happened on the chart, because $TRUMP did not quietly pull back, but encountered a violent shock. The token was issued as a political-themed Meme Coin and quickly became one of the most actively traded names in the category, attracting a large amount of rapid capital and also leading to a similar scale of short-selling liquidation.
Currently,$TRUMP is trading at $2.386, down 0.3% during the day. It broke through the downtrend channel earlier this week, but was rejected during a retest.
Official TRUMP Real-time Market Data
Indicator Value Price $2.38624 Hour Change-0.3% 24 Hour Range $2.22 - $2.45 Market Value $623.298M Fully Diluted Valuation $2.38B24 Hour Volume $346.378M circulating supply 261.881M total supply/maximum supply 1B Data source: CoinGecko's TRUMP market value data, as of September 5, 2026. Data from other tracking sites may differ slightly.
Official TRUMP exchange trading volume
Binance led $TRUMP transactions with a 24-hour volume of $249.2 million, followed by OKX at $224.52 million. 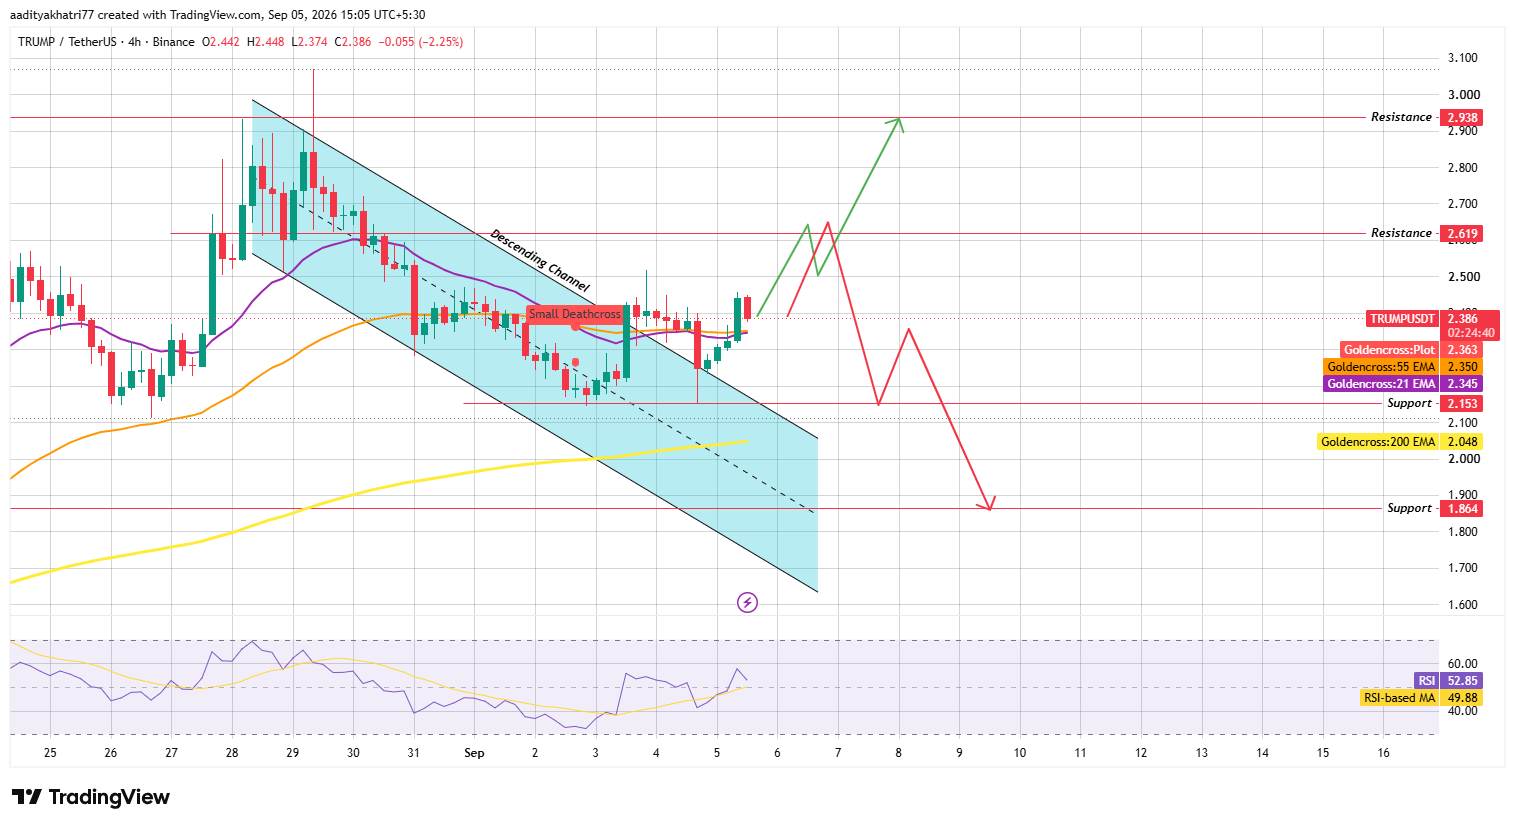 Bybit ranked third with transaction volume of $62.59 million, followed by Gate ($39.38 million) and Bitget ($34.81 million). Bitunix, WhiteBIT and KuCoin made small contributions and did not have a significant impact on the overall landscape. The market was mainly driven by Binance and OKX.
Official TRUMP Clearing Data
Time frame Total clearing amount Long clearing short clearing 1 hour $32.66K $31.73K $931.574 hours $550.13K $111.61K $438.51K12 hours $853.56K $271.44K $582.12K24 hours $4.10M $3.41M $684.05K Data source: CoinGlass clearing data, as of September 5, 2026.
Within 24 hours, the bulls suffered a larger loss, with a loss of $3.41 million, while the bears only lost $684.05 million. This is a highly unbalanced ratio, indicating that a large number of leveraged buyers are on the wrong side of this reversal. However, focusing on the past hour, bears are bleeding, which is consistent with the two-way sharp swings in the market.
TRUMP Price Forecast Outlook: Technical Analysis
The 4-hour TRUMP/USDT chart on Binance shows that prices have broken through a downward channel that had previously been stagnant for more than a week. The breakthrough was accompanied by real momentum, pushing $TRUMP above the exponential moving average (EMA), before sellers returned strongly.
Currently, prices have pulled back and are above these EMA levels, basically retesting the area where they broke through.
Can TRUMP be pushed to higher resistance levels?
For bulls, to maintain control here,$TRUMP needs to hold on to this retest and stay above the 21 EMA of $2.345. If this is done,$2.619 will become the first real target, and if the buying volume can be significantly amplified,$2.938 will be an extended target.
What happens if TRUMP loses this support area?
If the retest fails and the price closes back below the current EMA cluster at real volume, the situation will deteriorate rapidly. The next key support level is at $2.153. If even this falls, the decline could extend to $1.864, which is consistent with deeper support areas in early price movements.
The Relative Strength Index (RSI) read at 52.85, which is near neutral relative to the RSI moving average of 49.88. The momentum has not yet clearly pointed in any direction, which is in line with the market still judging the actual meaning of this retest.
Official TRUMP Support and Resistance Levels (4-hour chart)
Type Price Resistance Level 2$2.938 Resistance Level 1$2.619 Support Level 1$2.153 Support Level 2$1.864 Official TRUMP EMA Level (4-hour chart)
EMA Price Price Position 21 EMA$2.345 Price traded above 55 EMA$2.350 Price traded above Official TRUMP Price Forecast: Bullmarket, benchmark and bear market scenarios
Scenario setting conditions Target level bull market scenario retest held, prices remained above 21EMA with volume support, then $2.619, benchmark scenario prices fluctuated around the current retest area, no significant breakthrough, range between $2.20 and $2.45 Bear market scenario retest failed, Prices close back at $2.153 below the EMA cluster, with a downward channel towards $1.864 Risk Glossary
- :Two downward sloping parallel trend lines limit prices until prices break through in either direction.
- EMA (exponential moving average): Weights recent price behavior more heavily than old data, allowing it to respond more quickly to new momentum.
- RSI (Relative Strength Index): A momentum meter from 0 to 100 that tracks the rate and magnitude of price movement and is used to mark overbought or oversold conditions.
- Liquidation: An exchange forcibly liquidates a leveraged position when the margin is insufficient to cover losses.
- Support Area: A price area historically where buyers stepped in and prevented declines.
- Resistance zone: The level at which sellers previously contained a rebound.
TRUMP vs Bitcoin
$TRUMP's breakthroughs and reversals seem to be related to its own chart structure and not to anything in Bitcoin. That being said, memes and politically themed coins like $TRUMP tend to amplify the trend of Bitcoin's price today, and when Bitcoin moves in one direction, they move farther in both directions. Bitcoin's order book has deeper depth and long-term holder support, so its key levels tend to be more predictable than TRUMP, which is driven by retail leverage and leads to sharp swings like the $4.1 million liquidation figure seen here.
If Bitcoin remains solid,$TRUMP is likely to get an easier path to $2.619. If Bitcoin turns down, this retest may fail faster and more violently than Bitcoin's own pullback.
Expert Opinion
Market observers concerned about the $TRUMP breakthrough point out that clearing the downtrend channel is a truly bullish technical signal, but the scale of the huge liquidation wave during the reversal suggests that the market has gone too far. The level to watch for over the next trading session or two is whether TRUMP can hold this retest above its EMA, as this is likely to determine whether $2.619 will materialize or whether it will turn into a deeper pullback towards $2.153.
Disclaimer
This official TRUMP price forecast is based on technical analysis charts and current market data and should not be considered financial advice. The cryptocurrency market is highly volatile, and actual price changes may deviate significantly from forecast scenarios. The support and resistance levels discussed represent probability areas rather than guaranteed outcomes, and there are downside risks at every stage of the analysis. Readers should conduct independent research before making investment decisions.