Exchange Ranking
 Top Exchanges
 24h Volume Ranking
 Popularity Ranking
 Exchange BTC Balance
 Proof of Reserves
 Decentralized Exchanges
 Funding Rate
 Funding Heatmap
 Liquidation Data
 Max Pain
 Long/Short Ratio
 Whale L/S Ratio
 Binance/Okex/Huobi L/S
 Bitfinex Margin L/S
 ETF Tracker
 Solana ETF
 XRP ETF
 Hong Kong ETF
 Bitcoin Treasuries
 Crypto Reversal
 Ethereum Reserves
 HyperLiquid Wallet Analysis
 Hyperliquid Whale Watch
 Large Transactions
 On-chain Movement
 Bitcoin ROI
 Stablecoin Market Cap
 Options Analysis
 News
News Articles
 Economic Calendar
 Features
 Wallet
 Contract Calculator


 Security
 Collections
 Watchlist
 Following
 SOL
SOL Summary: Solana price forecast tests resistance around $110 to $113
Solana network activity supports a bullish price pattern
As long as SOL remains within the support range of $90.50 to $100.48, Solana price forecast remains bullish, with buyers targeting $110 to $113. If a breakthrough of $113 is confirmed, it may further hit the Fibonacci resistance levels of $132.93 and $160.42, and then enter the conditional $200 to $230 area.
During August, Solana processed approximately 5 billion transactions, and its apps generated $42.28 million in weekly revenue. The derivatives market performed mixed, with trading volume down 42.33% to US$4.44 billion, while open interest rose 2.86% to US$6.38 billion. Solana is currently trading at approximately $103.25, up 1.3% in 24 hours. This latest increase has focused Solana price forecasts on resistance between $110 and $113. Buyers continue to defend the broader $90.50 to $100.48 support range, with the structure backing another attempt to break through after months of consolidation.
SOL recorded daily trading volume of approximately US$2.15 billion, with a market value of US$60.45 billion. Market data also shows that app revenue on the Internet is strong and trading activity is frequent. Despite the mixed performance of derivatives indicators, the increase in open interest suggests traders are expecting greater market volatility. Bitcoin's overall recovery also provides buyers with a more solid background.
Solana price forecast tests resistance around $110 to $113
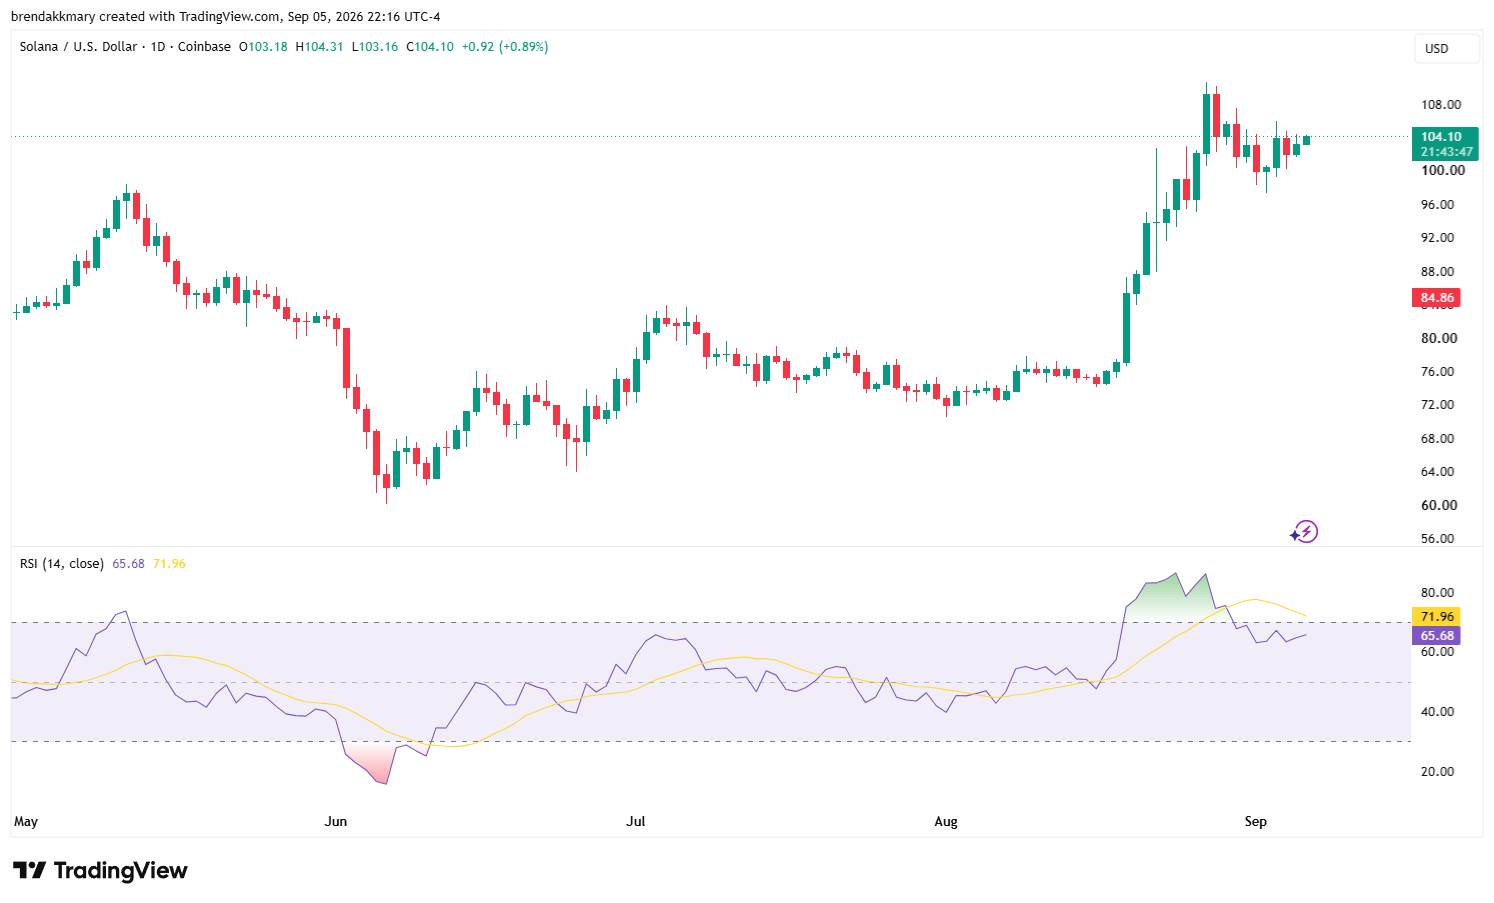
The three-hour chart shows that SOL broke through the pattern formed by June lows. At that time, sellers created lower highs and buyers gradually raised support. SOL prices have crossed the downward boundary of this pattern, improving their short-term trend.
The first upside target is near $113, above the immediate resistance level of $110.15. A decisive close in this region could establish a higher price range and draw attention to the next Fibonacci target of $132.93. Higher resistance levels appear at $160.42 and $209.63. Analyst More Crypto Online identified $200 as a long-term goal, while the chart marks $230. These goals remain conditional as SOL still faces downward trend line pressure extending from its 2025 highs.
The daily chart clearly defines the downside level. Initial support is at $100.48, in line with a Fibonacci retracement level of 23.6%. Further demand areas appear at $94.83 and $90.50, aligned with the retracement levels of 38.2% and 50%, respectively.
 Source: TradingView
Holding this range will retain the latest higher-highs scenario. A continued loss of $90.50 will weaken the bullish pattern and increase the risk of a deep correction. Therefore, Solana price forecasts depend first on holding support and secondly on buyers clearing $110 to $113 resistance.
Solana price forecasts also reflect cooling momentum. SOL has recently climbed to $114.80 from an initial June low of approximately $57.50. It also broke its 20-day simple moving average, which recently showed around $96.98. The Relative Strength Index (RSI) has fallen back to 65 from above 70 in the previously overbought area. This decline suggests a moderation in momentum, but has not reversed. SOL prices remain above the key moving average, keeping the recovery structure intact.
Solana Internet activity supports bullish price patterns
Solana Internet activity adds a fundamental dimension to Solana price forecasts. Blockchain processed approximately 5 billion transactions in August, with more than 100,000 transactions per minute. It achieves this transaction volume while keeping fees lower than multiple competing networks.
Solana processed 5 billion transactions in August, an incredible level of activity that exceeds all other networks combined. More than 100,000 transactions per minute. And it is done while maintaining costs several orders of magnitude lower than other chains.
-- Solana (@solana) September 5, 2026
Application revenue provides another measure of demand. The Solana app generated $42.28 million in revenue in one week, putting the network above rival chains. Trading platforms, decentralized financial services and consumer applications together contributed to this total. Consistent app revenue suggests that users continue to interact with the network outside of speculative token trading. High throughput and low transaction costs help applications support frequent activities. Continued demand can strengthen Solana price forecasts.
The derivatives market presents a fragmented picture. Trading volume fell 42.33% to $4.44 billion, indicating weakening short-term participation. At the same time, open interest increased 2.86% to $6.38 billion, indicating that traders are keeping their positions active despite lower turnover rates.
This combination may emerge before sharp price swings, as leverage remains open and immediate activity decreases. This does not confirm the direction, making spot support and resistance particularly important. Buyers need to maintain volume above $113 to verify breakthroughs and reduce the risk of false breakthroughs.
The recent roadmap focuses on three areas in the next few periods. SOL must defend $100.48 to maintain immediate momentum and hold $90.50 to protect the broader structure. Confirming a push through $110 to $113 will expose $132.93, while $160.42 will be the next technical hurdle.
Advertising here