Exchange Ranking
 Top Exchanges
 24h Volume Ranking
 Popularity Ranking
 Exchange BTC Balance
 Proof of Reserves
 Decentralized Exchanges
 Funding Rate
 Funding Heatmap
 Liquidation Data
 Max Pain
 Long/Short Ratio
 Whale L/S Ratio
 Binance/Okex/Huobi L/S
 Bitfinex Margin L/S
 ETF Tracker
 Solana ETF
 XRP ETF
 Hong Kong ETF
 Bitcoin Treasuries
 Crypto Reversal
 Ethereum Reserves
 HyperLiquid Wallet Analysis
 Hyperliquid Whale Watch
 Large Transactions
 On-chain Movement
 Bitcoin ROI
 Stablecoin Market Cap
 Options Analysis
 News
News Articles
 Economic Calendar
 Features
 Wallet
 Contract Calculator


 Security
 Collections
 Watchlist
 Following
 XRP
XRP XRP Price Outlook: Two key indicators send warning signals
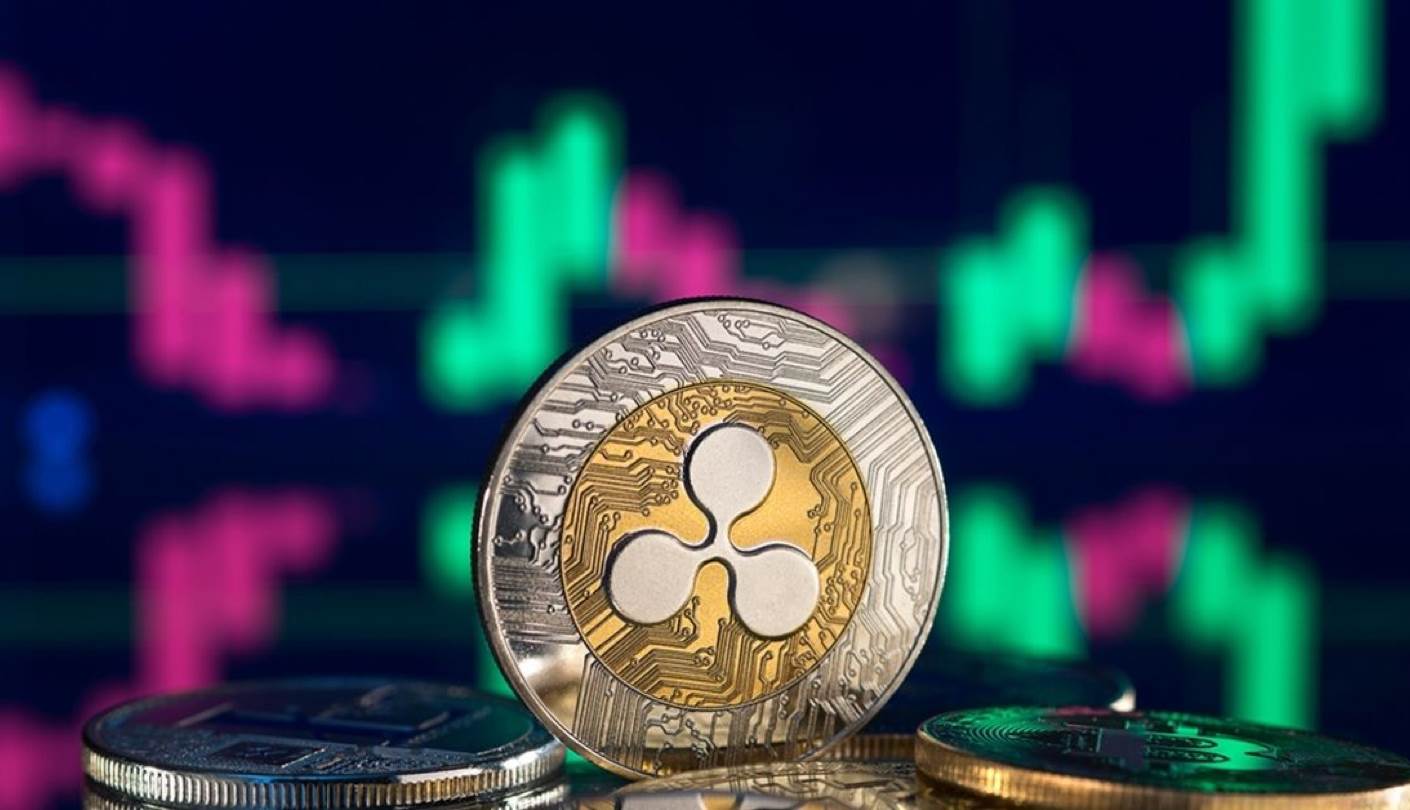
After the breakthrough on August 19, XRP experienced a strong rally, soaring from a key psychological support level of $1.00 to a multi-month high of $1.70 in just 72 hours. However, the subsequent correction was extremely severe, with the token losing several important support levels such as 1.60, 1.50 and recently 1.40 US$1.40 during the decline. Currently, XRP has fallen below US$1.40, and some on-chain data suggests that the market may face more downward pressure.
Activity plummeted
One of the most obvious reasons for the sharp breakthrough in XRP a few weeks ago came from giant whale investors. These large market participants frantically increased their holdings and swept up about 400 million tokens in a week or so. In addition, a surge in online activity shows increased market interest in XRP and the blockchain behind it.
However, according to the latest data shared by analyst Ali Martinez, the same investors have begun to dump such cross-border payment tokens. He cited data from Sanitation Intelligence as saying: "This correction is driven in part by profit-taking, with giant whales selling or reallocating approximately 90 million XRPs in the past week."
Naturally, such operations by major ecosystem participants have a dual effect: first, they increase immediate selling pressure; and second, retail investors tend to imitate the behavior of giant whales, exacerbating the downward trend.
Another major warning comes from declining Internet activity. The number of daily active addresses plummeted from a peak of 388,492 during the rebound to 38,163, a drop of more than 90%. Martinez said this marked a "significant decline in participation during the correction period."
The analyst added that XRP has found "key support" around $1.35, at which 2.29 billion coins had previously been traded. If assets can maintain this level, the next step may rebound to $1.60 or even $1.68.
600% surge is brewing?
Another well-known analyst, Celal Kucuker, is more optimistic about the future of XRP. He pointed out that the last round of XRP hit the all-time high began when its price fell below 12% of its 50-day moving average. Current data shows that XRP is in the same position.
Therefore, if this cross-border token can quickly recover the 50-day moving average, it may trigger another large-scale rally. Based on historical performance and Fibonacci isometric principle, the analyst predicts a possible increase of as much as 600%. If Kucuker's prediction comes true, the XRP price is expected to exceed US$9, more than double its current historical high.
Technical logic:
- The last round of all-time highs (ATH) rally began when XRP was 12% below the 50-day moving average.
- We are currently in the same position: 12% below the 50-day moving average.
- Above the 50-day moving average means the beginning of the XRP bull market.
- If the 13.55% downward channel breaks upward, based on the Fibonacci isometric principle, a 600% increase may be opened!