Exchange Ranking
 Top Exchanges
 24h Volume Ranking
 Popularity Ranking
 Exchange BTC Balance
 Proof of Reserves
 Decentralized Exchanges
 Funding Rate
 Funding Heatmap
 Liquidation Data
 Max Pain
 Long/Short Ratio
 Whale L/S Ratio
 Binance/Okex/Huobi L/S
 Bitfinex Margin L/S
 ETF Tracker
 Solana ETF
 XRP ETF
 Hong Kong ETF
 Bitcoin Treasuries
 Crypto Reversal
 Ethereum Reserves
 HyperLiquid Wallet Analysis
 Hyperliquid Whale Watch
 Large Transactions
 On-chain Movement
 Bitcoin ROI
 Stablecoin Market Cap
 Options Analysis
 News
News Articles
 Economic Calendar
 Features
 Wallet
 Contract Calculator


 Security
 Collections
 Watchlist
 Following
 BTC
BTC  SHIB
SHIB Shiba Inu Market Analysis and Outlook
Shiba Inu Coin started out as a meme-driven token, but has since built a real infrastructure around it, the most notable of which is the Shibarium secondary network, which aims to reduce transaction costs and support token destruction. Since its launch in 2020, the project has grown into one of the largest holder bases in the cryptocurrency market.
Current Shiba Inu price forecast analysis shows that the current trading price of SHIB is $0.00005394, up 1.6% in the past day. Considering the current macro background, this increase is noteworthy. The market value is close to US$3.179 billion, and the circulation is 5,892.39 trillion tokens.
Shiba Inu Real-time Market Data
Indicator Value Current Price $0.000539224 Hours Change +1.6% 24-hour Range $0.0005164- $0.00005411 Market Value $3.179 billion Fully Diluted Valuation $3.181 billion 24-hour Trading Volume $72.294 million circulating supply 589.239 trillion total supply 589.496 trillion data source: CoinGecko SHIB market value data, as of September 5, 2026. Data from other tracking sites may differ slightly.
Liquidation snapshots
Shorts have been squeezed in almost all time frames, which is consistent with the token's continued upward trend rather than a correction.
Time frame Total clearing amount Long and short 1 hour $6,700$0.04$6,7004 hours $6,880$0.04$6,88012 hours $6,880$0.04$6,88024 hours $95,100$85,460$9,640 Data source: CoinGlass clearing data, as of September 5, 2026
It's worth noting: Compared to the shorter time frame, the 24-hour data reversed, with bulls taking most of the losses. The mismatch suggests a difficult period earlier in the day before a recent rebound.
Exchange trading volume
OKX and LBank currently account for the majority of $SHIB trading volume, far exceeding other platforms.
Exchange trading volume OKX $13.96 million LBank $12.28 million Bitget $4.72 million MEXC $4.17 million Gate $2.82 million Bitunix$2.13 million WhiteBit$1.25 million KuCoin$1.13 million Data source: According to CoinGlass trading volume heat map data, as of September 5, 2026,
Shiba Inu Coin News
Shibarium's destruction tracker has some abnormalities. The page that normally displays the number of $SHIB tokens sent to dead wallets stopped working and instead throws red error messages that no longer display real-time data. Shibarium should have used part of its transaction costs for these destruction operations, gradually reducing the circulation supply of SHIB. Therefore, when the tracker stops updating, holders who pay close attention to the indicator will naturally raise questions. 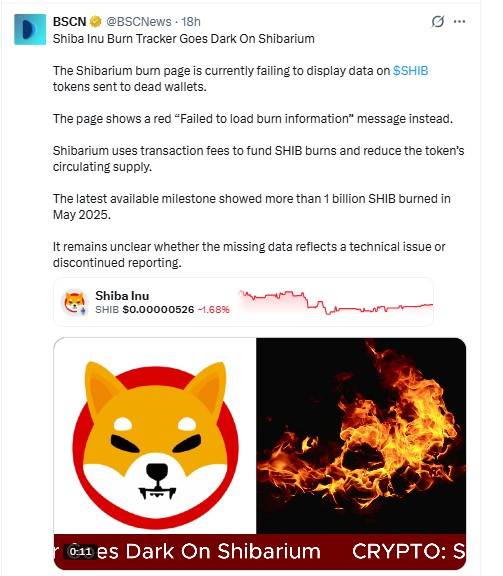
Data source: @BSCNews X account, as of September 5, 2026
The last confirmed figure anyone has is that as of May 2025, more than 1 billion $SHIBs have been destroyed. It is unclear whether the outage was a simple technical failure or a more permanent issue, such as the cancellation of reporting functions. In any case, such information gaps often fuel speculation until an official explanation emerges.
Technical Analysis
SHIB's 4-hour chart shows a fairly clear rising triangle, with prices just building a running candle of strong volume above the 21EMA. This trend usually signals a decisive breakthrough in prices in a certain direction.
Data source: TradingView chart, as of September 5, 2026
There are two development paths for this situation. If the price breaks the upper boundary of the triangle with volume support,$0.0000567 will become the first target. After breaking through this position, the path will extend to $0.0000596, and if the buyer maintains control,$0.0000622 will be a more longer-term goal.
Conversely, if a rejection is encountered at the top resistance level and the seller intervenes firmly, the price may fall back to $0.0000512. From there, a deeper callback risk test of $0.0000488 will be found on a firmer foundation.
Support and Resistance Levels
Type Horizontal Resistance 3$0.0000622 Resistance 2$0.0000596 Resistance 1$0.0000567 Support 1$0.0000512 Support 2$0.00000488 EMA Level (4-hour chart)
EMA Price 21 EMA$0.000052655 EMA$0.0000522200 EMA$0.0000500 The RSI currently reads 60.84, and the moving average based on the RSI is slightly lower at 57.68. The gap between the two usually occurs when momentum is accumulating but has not yet been fully confirmed. It is not overheated, but is just biased towards bullish.
Glossary
Rising Triangle: It is formed when prices repeatedly test the same resistance level and the support level below continues to climb, squeezing prices into a tightening range until they finally break through in a certain direction.
Death Crossing: This occurs when the short-term moving average crosses the long-term moving average and is often seen as a warning sign of a weakening trend.
Gold Cross: Contrary to a death cross, it refers to the short-term moving average crossing the long-term moving average and is usually seen as a signal that buyers regain control of the market.
Liquidation: What happens when a leveraged position is forcibly closed because a loss eats up the trader's available margin.
RSI (Relative Strength Index): measures the speed and magnitude of recent price fluctuations, with a score ranging from 0 to 100, and is mainly used to mark whether prices are overextending in either direction.
Comparison between SHIB and Bitcoin
The current trend of SHIB does not seem to draw much from Bitcoin's operating model. The story of the triangle shape and the destruction of the tracker are unique to SHIB's own charts and ecosystem news, and nothing in today's Bitcoin price movement can explain any of these factors. Currently, this Shiba Inu price forecast relies more on the volume and structure of the SHIB itself, rather than any current Bitcoin price forecast.
Expert Opinion
Traders focusing on this pattern point out that forming a candle of strong volume within the tightening triangle, near the 21EMA, is usually a signal that the market is preparing for a breakthrough rather than just a sideways consolidation. This view fits the current picture: $SHIB is moving upwards against a triangular resistance level and supported by volume, although unrelated data outages add a layer of uncertainty to the destruction narrative.
Disclaimer
This Shiba Inu price forecast is based on technical chart analysis and current market data and should not be regarded as financial advice. The cryptocurrency market is extremely volatile, and actual price changes may deviate significantly from forecast scenarios. The support and resistance levels discussed represent probability areas rather than guaranteed outcomes, and there are downside risks at every stage of this analysis. Readers should conduct independent research before making investment decisions.