Exchange Ranking
 Top Exchanges
 24h Volume Ranking
 Popularity Ranking
 Exchange BTC Balance
 Proof of Reserves
 Decentralized Exchanges
 Funding Rate
 Funding Heatmap
 Liquidation Data
 Max Pain
 Long/Short Ratio
 Whale L/S Ratio
 Binance/Okex/Huobi L/S
 Bitfinex Margin L/S
 ETF Tracker
 Solana ETF
 XRP ETF
 Hong Kong ETF
 Bitcoin Treasuries
 Crypto Reversal
 Ethereum Reserves
 HyperLiquid Wallet Analysis
 Hyperliquid Whale Watch
 Large Transactions
 On-chain Movement
 Bitcoin ROI
 Stablecoin Market Cap
 Options Analysis
 News
News Articles
 Economic Calendar
 Features
 Wallet
 Contract Calculator


 Security
 Collections
 Watchlist
 Following
Pi Network Price Forecasting and Technical Analysis
Pi Network was originally a mobile mining project that allowed users to earn PI tokens directly through smartphone applications without having to invest high hardware costs like other cryptocurrencies. The project then transitioned to an open mainnet, allowing holders to trade the token on a major exchange for the first time. Since then, PI has established one of its large self-reported user bases among emerging digital assets, attracting steady attention from global retail traders as the market's attention to Pi Network price forecasts continues to heat up.
Pi Network's price today is $0.09421, down 2.3% in the past 24 hours, and its market value is $1.052 billion.
Pi Network Real-time Market Data
Indicator Value Price $0.0942124 Hour Change-2.3% 24-Hour Range $0.09349-$0.09678 Market Value $1.052 billion Fully Diluted Valuation $1.619 billion 24 Hour Volume $54.37 million circulating supply 11.171 billion total supply 17.187 billion maximum supply 100 billion data source: Pi Coin market data from CoinGecko, as of September 12, 2026. Data from different tracking sites may differ slightly.
Pi Network Market Sentiment
Today's news about Pi Network focuses mainly on the project's community size rather than specific price catalysts. BSCN listed the story of Pi's core team as one of the more compelling developments in the crypto space, pointing out how the project has built a following of millions of users through its mobile mining model. The media's coverage focuses on user growth and adoption rather than any recent technical or fundamental triggers, portraying the Pi Network's trajectory as an ongoing community story rather than a single event.
 Data source: From @BSCNews X account, as of September 12, 2026.
Technical Analysis: 4-hour chart
Pi Network currency price is currently testing the flat support level of the falling triangle on the 4-hour chart, with the candle chart on September 12 closing at $0.09424.
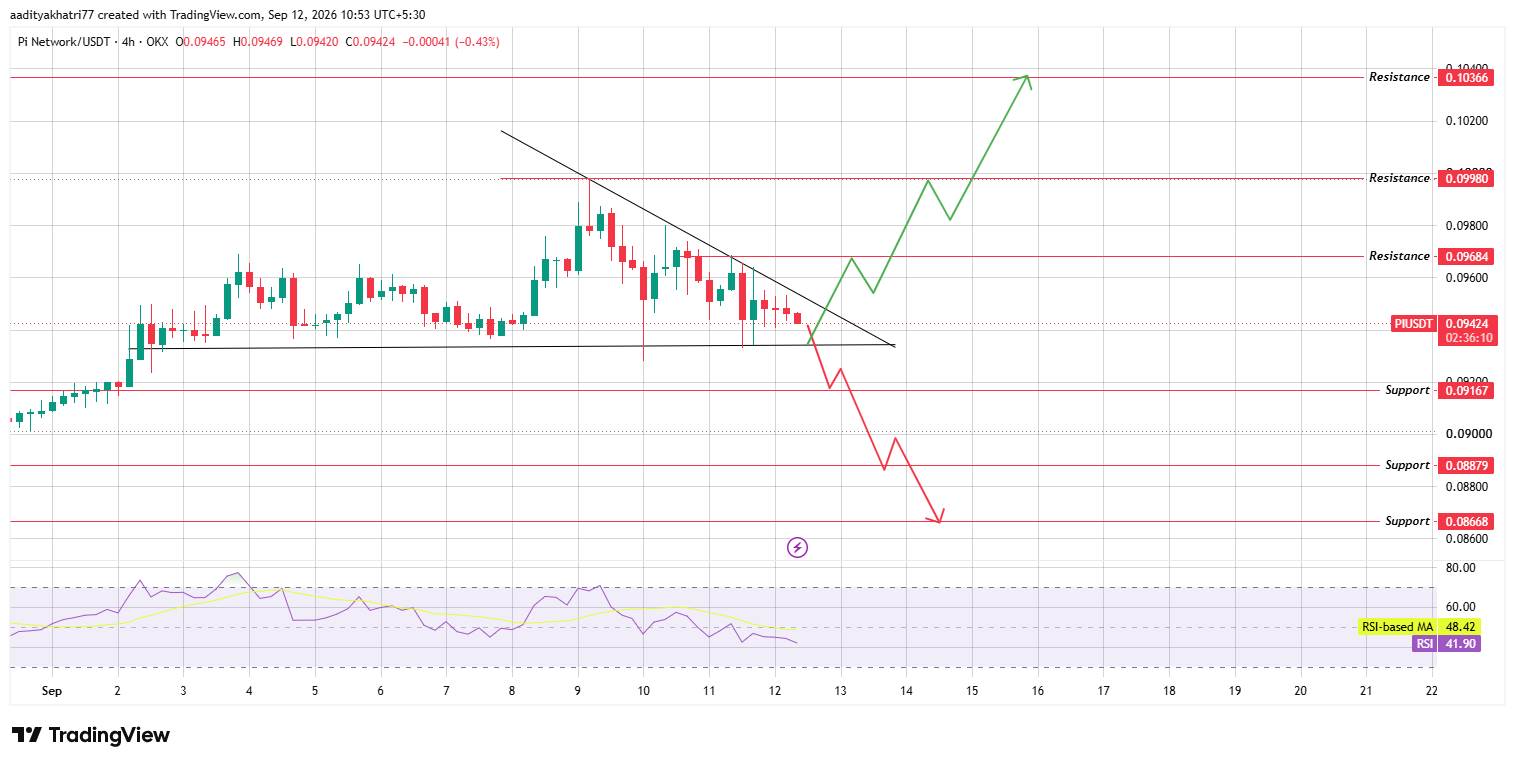 The RSI read at 41.90, below its moving average of 48.42, reflecting that price momentum is weakening as it approaches this key level.
Bullish scenario: Can PI rebound and break through the trend line?
If the price holds flat support near $0.09167 and closes above the downtrend line with volume confirmation, the Pi Network coin price may move first towards $0.09684, followed by $0.09980 and $0.10366. Such a breakthrough would mark the end of weeks of compression and turn momentum back on the buyer.
Bear scenario: What happens if support breaks?
If the flat support level at $0.09167 fails to hold, Pi Network risks falling to $0.08879, and further weakness could extend to $0.08668. A break from the falling triangle usually means a continuation of the previous downtrend, so once it is confirmed that the closing price is below support, it will benefit sellers in the short term.
Pi Network Support and Resistance
Support Resistance $0.09167 $0.09684 $0.08879 $0.09980 $0.08668 $0.10366 Pi Network Bull Market Benchmark and Bear Market Scenarios
Scenario Set Target Price After the bull market support level is held, the trend line runs within the triangle with trading volume exceeding $0.10366. The benchmark price is repeatedly tested at $0.09167-$0.09684 The bear market flat support level breaks. Downtrend recovery $0.08668 Pi Network vs. Bitcoin
Due to the relatively late main online line of Pi Network and the unique holder base established through mobile mining, its price trend is directly correlated with Bitcoin. The correlation is not as obvious as the more mature altcoins. Still, broader market risk sentiment, which tends to follow Bitcoin's trend, still affects whether the Pi Network's triangle is resolved upwards or downwards. Stable or rising bitcoin market prices often provide the volume support needed for altcoins such as PI to break out of integrated form.
Expert Opinion
The current market commentary surrounding Pi Network sees falling triangles as a pattern worth keeping a close eye on because triangle vertex testing tends to lead to more violent volatility than usual once resolved. Analysts pointed out that a breakout of the trendline accompanied by volume is the clearest bullish signal, while a break in support levels lacking a rebound could confirm a continuation of the recent downtrend. Given the low volume of Pi Network transactions relative to high-volume tokens, commentators warn that any resolution can happen quickly once it reaches its peak.
Disclaimer
This Pi Network price forecast is based on technical chart analysis and publicly available data as of September 12, 2026. Cryptocurrency prices fluctuate sharply, and actual results may be quite different from the scenario described. There is a possibility that both bullish and bearish targets will not be achieved, and readers should not regard any price quoted here as a guaranteed result. This content is for reference only and does not constitute financial advice.