Exchange Ranking
 Top Exchanges
 24h Volume Ranking
 Popularity Ranking
 Exchange BTC Balance
 Proof of Reserves
 Decentralized Exchanges
 Funding Rate
 Funding Heatmap
 Liquidation Data
 Max Pain
 Long/Short Ratio
 Whale L/S Ratio
 Binance/Okex/Huobi L/S
 Bitfinex Margin L/S
 ETF Tracker
 Solana ETF
 XRP ETF
 Hong Kong ETF
 Bitcoin Treasuries
 Crypto Reversal
 Ethereum Reserves
 HyperLiquid Wallet Analysis
 Hyperliquid Whale Watch
 Large Transactions
 On-chain Movement
 Bitcoin ROI
 Stablecoin Market Cap
 Options Analysis
 News
News Articles
 Economic Calendar
 Features
 Wallet
 Contract Calculator


 Security
 Collections
 Watchlist
 Following
 SUI
SUI SUI Price Forecast: Strong Recovery and Chain Milestones after Breakthroughs
SUI's price forecast heat up again as it strives to climb above the critical level that it deceived traders hours ago. The chart tells a story that investors who closely follow the cryptocurrency market can recognize at a glance: a currency is rejected almost immediately after a breakthrough, then turns around and returns to the same position with firm determination. On this basis, Sui Network itself has ushered in a new milestone, using specific data to quantify the scale of real activities occurring on the chain. As a result, what is happening here is far more abundant than mere price fluctuations suggest. The following is a comprehensive market picture.
SUI Price Today: Real-time Data and 24-Hour Changes
At the time of writing, SUI was trading at $0.7226, a drop of nearly 2.3% during the day, having previously dropped approximately $0.017. The correction was accompanied by a large amount of derivatives activity, with futures trading volume reaching US$900.09 million in the past 24 hours, while spot trading volume was only US$194.71 million. This large gap suggests that leveraged traders played the main driving role in this market, rather than real spot demand or selling.
SUI's market value is currently US$2.96 billion and open interest value (Open Interest) is US$602.92 million, which means that there is still a large amount of leverage exposure hanging on the books, which may add momentum in the direction of final resolution of the breakthrough area. The circulation supply is 4.09 billion SUIs, and the total supply and maximum supply are 10 billion units. Therefore, the current circulation is less than half of the final supply.
Sui network milestone adds new perspective to SUI forecasts
Looking off the chart, Sui has just crossed a number worth stopping and paying attention to. 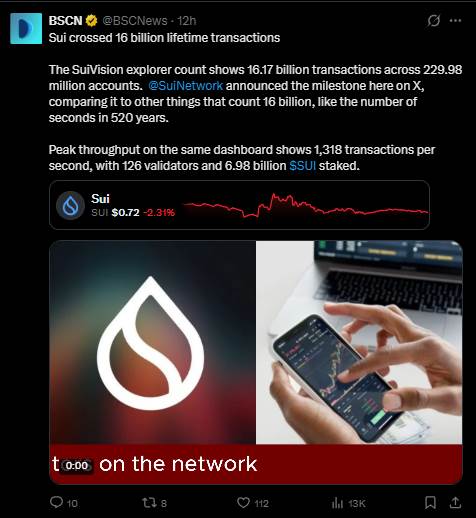 According to an article published by BSCN on the X platform, the SuiVision browser now shows that there are 2.2998 million accounts on the network, with a cumulative lifetime transaction volume of 16.17 billion.
The article pointed out that Sui Network itself used comparison to frame the significance of this milestone, pointing out that 16 billion is approximately equivalent to 520 years of seconds. This scale is difficult to grasp at the abstract level, but it is enough to clearly convey its meaning. The same dashboard shows that peak throughput reaches 1,318 transactions per second, there are currently 126 verifiers ensuring network security, and 6.98 billion SUIs are pledged.
This is quite different from normal price discussions, as it points to the continued accumulation of real usage on the Internet, not just speculative trading volume. For traders making SUI price forecasts in the coming weeks, it would be wise to pay close attention to whether such throughput and pledge data continue to rise, as network health indicators like these tend to move more slowly than prices, but can be significant when emotions catch up with them.
Quick overview: Overview of SUI price trends
- Current market price (CMP):$0.7231 (1-hour chart, Binance)
- Recent trend: Prices previously broke through the downtrend line, but failed almost instantaneously, and then buyers stepped in strongly from support.
- Hour trigger conditions: Achieving a sustained close above 0.7660 will confirm a breakthrough and open paths to 0.8457 and 0.9541.
- Failure point: A closing risk below 0.7075 may cause a slide to 0.6863.
- Momentum readings: Chart oscillator readings are close to 41.93, marking bullish as buyers are defending recovered areas.
- Data Timestamp: September 12, 2026, 1-hour Binance Perpetual Contract Chart.
- Risk warning: Leveraged positions remain high, so no matter which direction the breakthrough goes, it may be faster than simply implied by spot activity.
SUI Technical Analysis: A failed breakthrough turns into a battle for recovery
Observe the 1-hour SUI/USDT perpetual contract chart on Binance. The story here is that of a currency that tried to escape its downtrend line was punished almost immediately and is now attempting a second breakthrough with more pronounced intensity. 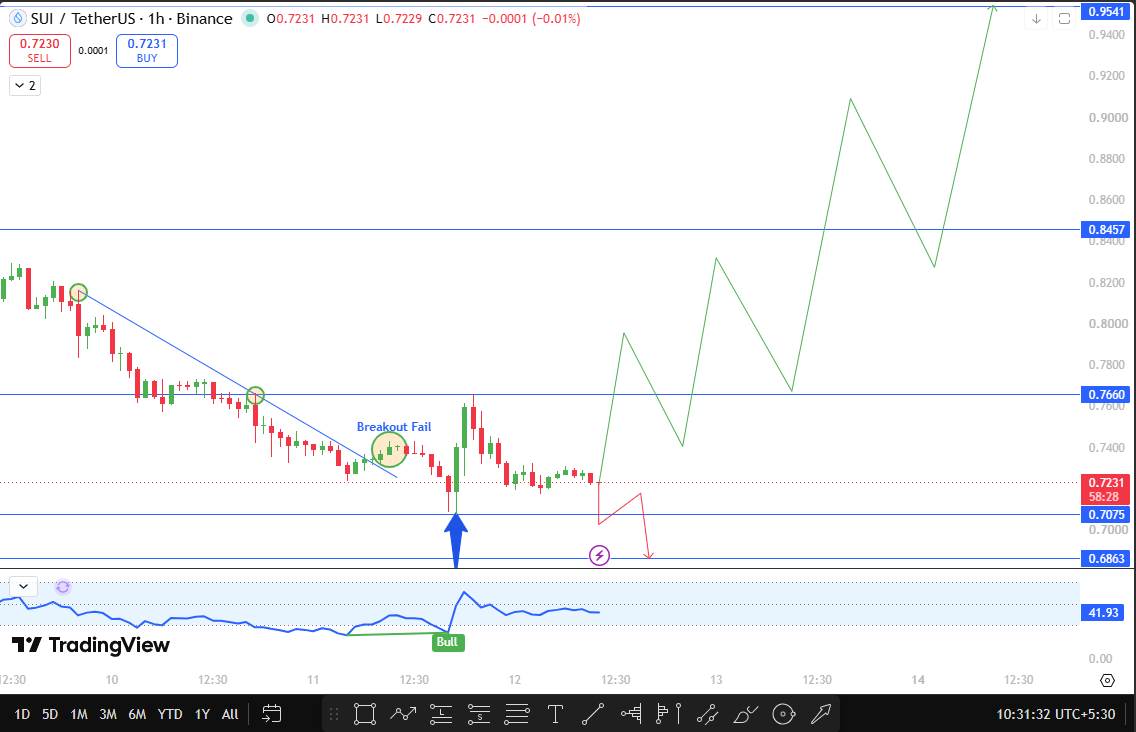 Prices broke through the trend line earlier in the round, but the breakthrough failed at the next K-bar, causing SUI to plummet to the 0.7075 support zone.
What happened next is worth paying attention to. The price did not fall further, but there was huge buying pressure at the 0.7075 support level. The price rebounded strongly and closed above the original breakthrough level, effectively recovering the area that had just rejected it.
The oscillator reading on the chart is close to 41.93 and carries a bullish label, which is consistent with the strength of the rebound from support, although prices are still struggling to prove that the breakthrough is real and not another trap. If the SUI can close above $0.7660, this will confirm that the breakthrough is real and that buying pressure has the upper hand. The next resistance level to focus on is at $0.8457, which will be the first real test of this SUI's technical analysis setup. Once a breakthrough is confirmed,$0.9541 will become the main target for the longer term.
On the other hand, if the support of 0.7075 eventually collapses and the SUI closes below this, it means that the recovery attempt has failed and the seller has regained control of the situation, opening the door to a retest of $0.6863, a level that marks a clear break from the current structure.
SUI Support and Resistance Levels to Watch
SUI Key Price Level vs. CMP $0.7231
Level Type Price Distance from CMP Main Resistance Level $0.9541+31.9% Resistance Level 2$0.8457+17.0% Resistance Level 1$0.7660+5.9% Current price $0.7231-Support level 1$0.7075-2.2% Main support level $0.6863-5.1% SUI's bull market, benchmark and bear market scenarios
The bull market path forecast for this SUI price depends on whether buyers can turn this recovery into a confirmed breakthrough. A close above $0.7660 will be the clearest signal that the previous failed breakout was just a wash rather than a real reversal. If this level is maintained,$0.8457 will be the next test, while $0.9541 is a bigger goal farther away. Given that the rebound from support has already occurred so violently, this is a path that could advance quickly if momentum continues to accumulate.
The benchmark scenario is a more robust outcome, consistent with the market's self-proving state after experiencing a failed breakthrough. The SUI may spend more time oscillating between 0.7075 and 0.7660, waiting for traders to make a decisive close in either direction, especially considering that network milestone news is still fresh and has not yet been fully priced by the market.
If the support level of 0.7075 breaks and SUI closes below it, a bear market scenario will dominate the market. This will open the downward channel to 0.6863, and combined with futures trading volume still far above spot trading volume, the break here cannot be ignored, especially if broader market sentiment deteriorates at the same time.
The risk of this SUI price forecast
Leveraging positions remain high relative to spot activity, which means that once the area is resolved, decisive movement may be quickly amplified by clearing piled up on one side of the ledger. The speed at which online trading and pledge milestones translate into price actions is also a real variable, as markets do not always price usage data immediately. The broader crypto market environment is also important, because sudden changes in Bitcoin or shifts in overall risk appetite can easily override the current technology landscape, no matter how clean the recovery may seem on the chart.
Explanation of key terms
- Trendline: A line connecting a series of high or low prices, indicating the direction of price respect, usually serving as support or resistance before a breakthrough.
- Open Interest: The total number of derivative contracts (such as futures) that have not yet been settled, often used to measure the amount of leveraged funds active in the market.
- Breakout Fail: refers to the situation where prices move above a key resistance level or trend line, but cannot maintain the movement and quickly fall back below the level where they just broke through.
Disclaimer
This article is for reference only and should not be regarded as financial advice. The cryptocurrency market is extremely volatile, and price forecasts are based on technical analysis and may change rapidly as new markets develop. Before making any investment decisions, be sure to conduct your own research.