Exchange Ranking
 Top Exchanges
 24h Volume Ranking
 Popularity Ranking
 Exchange BTC Balance
 Proof of Reserves
 Decentralized Exchanges
 Funding Rate
 Funding Heatmap
 Liquidation Data
 Max Pain
 Long/Short Ratio
 Whale L/S Ratio
 Binance/Okex/Huobi L/S
 Bitfinex Margin L/S
 ETF Tracker
 Solana ETF
 XRP ETF
 Hong Kong ETF
 Bitcoin Treasuries
 Crypto Reversal
 Ethereum Reserves
 HyperLiquid Wallet Analysis
 Hyperliquid Whale Watch
 Large Transactions
 On-chain Movement
 Bitcoin ROI
 Stablecoin Market Cap
 Options Analysis
 News
News Articles
 Economic Calendar
 Features
 Wallet
 Contract Calculator


 Security
 Collections
 Watchlist
 Following
 ETH
ETH The volume of open interest in altcoins excluding Ethereum is still higher than that in Bitcoin, and Ted warns that high leverage may trigger large-scale clearing.
The cumulative amount of altcoin inflows in the past seven days has reached one of its highest levels in months, indicating that exchange activity is heating up. The medium and small market cap markets are currently remaining around US$203 billion, and the resistance level of US$205 billion and the support level of US$200 billion will determine the next trend.
As leverage remains high and more tokens are transferred to exchanges, the altcoin market is facing new selling pressure. Analyst Ted pointed out that the open interest volume of altcoin after excluding Ethereum still exceeds the open interest volume of Bitcoin. At the same time, analyst Maartunn reported that seven days of cumulative inflow trading volumes have climbed to a multi-month high.
Altcoins have more open interests than Bitcoin
According to Ted's analysis, altcoins other than ETH hold more open interests than Bitcoin. Ted said there was "moderate leverage" in the altcoin market and expected many positions to be liquidated in the coming weeks. His comments focused mainly on exposure to altcoin derivatives.
However, Ted did not provide specific open interest data, nor did he clearly identify which tokens face the highest exposure. Maartunn reported that altcoins were once again flowing to exchanges. He added that cumulative inbound trading volume over the past seven days had surged to one of the highest levels in months.
However, the data provided does not show the total value of the transferred tokens, nor does it specify the specific exchanges involved. These inflow figures appear after Ted's comments on derivatives leverage. Ted focuses on open interest volume, while Maartunn looks at exchange-traded data.
Small and medium-cap markets test the US$205 billion mark
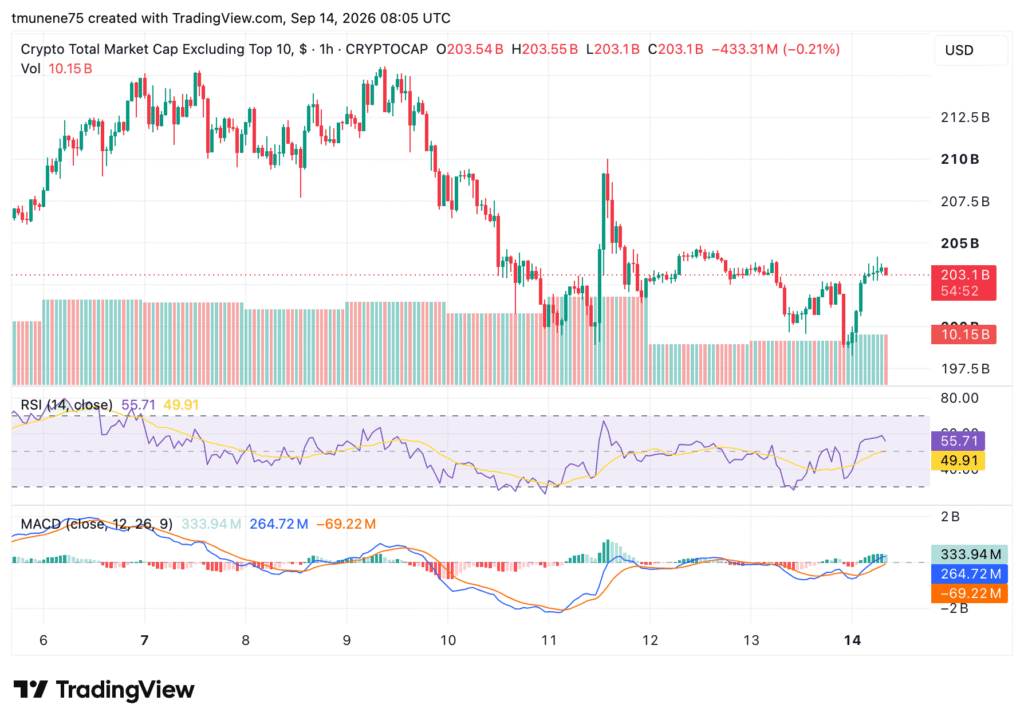
On the 1-hour chart, the total market value of cryptocurrencies excluding the top ten cryptocurrencies is approximately US$203.1 billion. The market value rose to more than US$212.5 billion on September 7, approached US$214 billion again on September 9, then fell back to the US$198 billion to US$200 billion range, and then rebounded.
Source: TradingView
The current recovery has leveled off around US$203 billion. The chart shows that $205 billion is the direct resistance level, followed by the $207.5 billion to $210 billion range. Support appears at US$200 billion, and stronger support is around US$197.5 billion to US$198 billion.
The Relative Strength Index (RSI) was 55.71, above its moving average of 49.91. The MACD bar chart is positive $333.94 million, the MACD line reaches $264.72 million, and the signal line is negative $69.22 million.