Exchange Ranking
 Top Exchanges
 24h Volume Ranking
 Popularity Ranking
 Exchange BTC Balance
 Proof of Reserves
 Decentralized Exchanges
 Funding Rate
 Funding Heatmap
 Liquidation Data
 Max Pain
 Long/Short Ratio
 Whale L/S Ratio
 Binance/Okex/Huobi L/S
 Bitfinex Margin L/S
 ETF Tracker
 Solana ETF
 XRP ETF
 Hong Kong ETF
 Bitcoin Treasuries
 Crypto Reversal
 Ethereum Reserves
 HyperLiquid Wallet Analysis
 Hyperliquid Whale Watch
 Large Transactions
 On-chain Movement
 Bitcoin ROI
 Stablecoin Market Cap
 Options Analysis
 News
 Articles
 Economic Calendar
 Features
 Wallet
 Contract Calculator


 Security
 Collections
 Watchlist
 Following
 SHIB
SHIB价格维持在0.0000059美元附近,MACD转为正值,买盘活动增强
在今天的交易时段中,SHIB的价格维持在0.0000059美元附近。随着MACD指标转正,图表上的买入活动显著增强。若以约589万亿枚流通SHIB计算,达到0.01美元的目标意味着市值将达到约5.9万亿美元。这一估值目标使得供应量问题成为长期辩论的核心焦点。
随着价格在图表上接近0.0000060美元水平时动能改善,供应减少和采用率的提升依然是围绕“一美分”目标辩论的中心议题。SHIB价格在最新的交易区间内显示出新的上涨动能,而关于供应量的担忧则使该目标与燃烧机制、采用率以及随时间推移的供应缩减紧密相连。
供应数学模型塑造“一美分”辩论
0.01美元的目标依然集中在SHIB异常庞大的流通供应量上。大约589万亿枚代币将意味着5.9万亿美元的市值。这一计算框定了在当前供应水平下所需的估值规模。
Terrarmy(@terra_army)的帖子直接将这一供应问题置于聚光灯下。该帖指出,一美分的目标并非因供应量大而永久不可实现,但达到这一水平需要大规模的供应缩减以及实质性的采用增长。https://twitter.com/terra_army/status/2103682407279022169?s=20
该帖子将“燃烧”叙事置于讨论中心。据报道,已有超过410.8万亿枚SHIB从原始供应量中被移除。根据提供的数据,目前仍有约585.5万亿枚SHIB处于流通状态。
已燃烧代币与剩余供应量之间的差异至关重要。燃烧机制会随着时间的推移减少可用于流通的代币数量。然而,剩余的庞大数量仍然构成了更高的估值门槛。
技术面动能全面改善
截至撰写本文时,SHIB的交易价格约为0.000005916美元。该代币在24小时内上涨了1.74%,总市值攀升至约34.8亿美元。24小时交易量超过1亿美元,成交量增长了16.04%。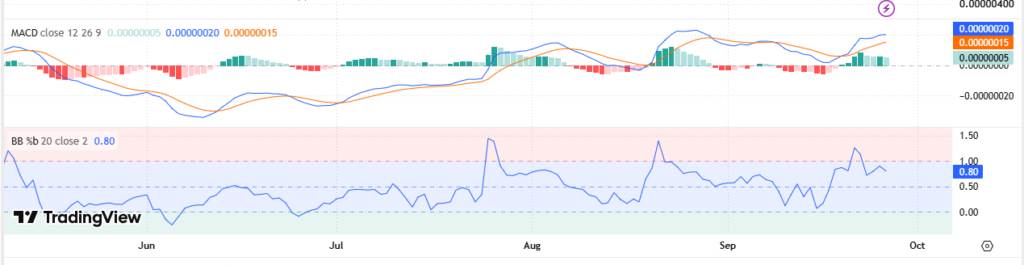 来源:TradingView
价格起初在0.00000577美元附近起步,随后攀升至多个日内高点。该交易时段的高点触及0.00000605美元。随后SHIB反弹并在0.00000590美元区域震荡回调。
MACD面板也显示了近期读数中的动能改善。蓝色MACD线已穿越橙色信号线之上,柱状图也翻绿。目前的分离幅度适中,因此动能扩张仍处于相对可控的范围。
Bollinger Band %B(布林带百分比带宽)为技术结构增添了另一层维度。该指标位于0.84附近,表明价格处于其区间的上部。早期的读数曾短暂突破1.0,随后回落并再次回升。
0.0000060美元级别成为关键参考点
The latest price structure puts $0.000060 at the center of attention. If it can be maintained above this level, the structure of recent recovery will be maintained. The high of close to $0.0000605 in previous sessions also provided another nearby reference level for price movements.
The chart also shows buyers defending at high prices after a sharp intraday correction. SHIB rebounded repeatedly rather than immediately taking back to intraday lows. This pattern indicates continued buying interest within the displayed Trading Range.
At the same time, a higher %B reading signals that price positioning is relatively overbought. Therefore, a sharp reversal could pull the indicator back into its middle position. If MACD's bullish cross reverses, its bullish effect will also weaken. [TAG
The supply-side debate is separate from these short-term technical indicators. Price momentum changes rapidly, while supply declines and adoption increases require longer cycles. Thus, the material presented links the current recovery to the broader penny discussion.