Exchange Ranking
 Top Exchanges
 24h Volume Ranking
 Popularity Ranking
 Exchange BTC Balance
 Proof of Reserves
 Decentralized Exchanges
 Funding Rate
 Funding Heatmap
 Liquidation Data
 Max Pain
 Long/Short Ratio
 Whale L/S Ratio
 Binance/Okex/Huobi L/S
 Bitfinex Margin L/S
 ETF Tracker
 Solana ETF
 XRP ETF
 Hong Kong ETF
 Bitcoin Treasuries
 Crypto Reversal
 Ethereum Reserves
 HyperLiquid Wallet Analysis
 Hyperliquid Whale Watch
 Large Transactions
 On-chain Movement
 Bitcoin ROI
 Stablecoin Market Cap
 Options Analysis
 News
News Articles
 Economic Calendar
 Features
 Wallet
 Contract Calculator


 Security
 Collections
 Watchlist
 Following
 BTC
BTC  DOGE
DOGE Dogecoin price forecast: The popularity of dogcoin price forecast is rising again, DOGE is at a critical observation level
The popularity of dogcoin price forecast is heating up again, and DOGE is at a critical moment that allows chart observers to keep a close eye on the screen.
After weeks of choppy downturns in a contracted pattern, DOGE finally broke through the critical boundary, but then turned back and tested the same area again.
The question on every trader's mind at the moment is: Is this correction just a healthy rest before the next round of gains, or is it a warning signal for a premature breakthrough?
The price and structure discussed below are all from the daily chart of DOGE/USDT perpetual contracts on the Bybit platform (data source: TradingView).
Since this is a short-term intraday to swing trading setting, if prices close significantly outside the range, these levels should be re-checked.
DOGE Current Price
Current Price: $0.07003
24-Hour Change: -0.19%
Market Value: $11.98B
Futures Volume (24 hours):$649.34M
Spot Volume (24 hours):$61.26M
Open interest: $1.17B
Open supply: 171.19B
Total supply: 171.19B
Open interest is the total value of DOGE futures contracts that have not yet been settled or closed. An increase in open interest as prices usually means that new funds have entered a trend; while a decline in open interest as prices fall may suggest that the trend is driven by short covering or long clearing rather than real new demand.
Chart source: TradingView, DOGEUSDT Perpetual Contract, Bybit, daily cycle, intercepted at 09:59 IST (04:29 UTC) on August 14, 2026. Market data source: CoinGlass, dogcoin overview page, intercepted on August 14, 2026.
Methodology and data sources
This dogcoin price forecast is entirely based on the daily chart structure of today's trading session, combined with real-time market data and clearing data from CoinGlass. No external analyst forecasts or additional market comments were added. All support, resistance and targets mentioned below come directly from the band highs and lows marked on the chart, as well as the declining wedge pattern that DOGE has broken through.
DOGE Spot ETF Fund Flow: Information revealed by data
Dogcoin Spot ETF activity provides more background information for today's trend. 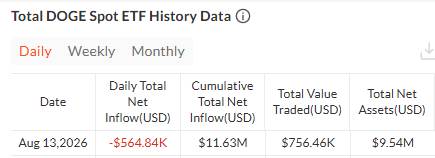 On August 13, 2026, the DOGE Spot ETF portfolio recorded a daily net outflow of $564.84K, although the cumulative net inflow since launch remained positive at $11.63M. The total transaction volume on the day was $756.46K, and the total net assets were $9.54M. For a newly launched ETF product, it is not uncommon for an outflow of this magnitude in a single day and will not change the technical aspects of it, but it will be worthwhile to track it together with price movements in the next few trading days.
Liquidation snapshot: leverage pressure area
The past 24 hours have been difficult for DOGE bulls. 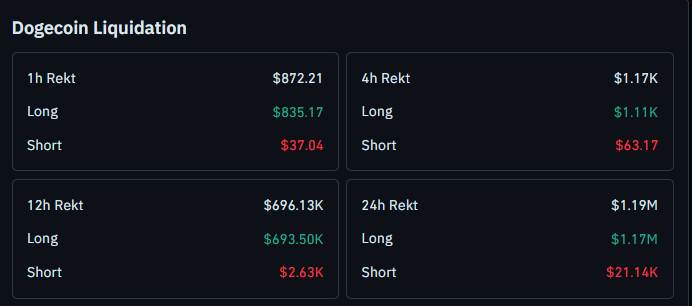 The total clearing amount during this period reached $1.19M, of which $1.17M came from long positions being cleared, while short positions were only $21.14K. This imbalance is equally evident in all shorter time windows. In the past 12 hours, the long clearing amount was $693.50K, accounting for the vast majority of the total clearing amount of $696.13K. Even in the past 1 hour and 4 hours, the long clearing amounts were $835.17 and $1.11K respectively, which far exceeded the short side's $37.04 and $63.17. This one-sided pattern suggests that leveraged traders have repeatedly been bullish on resistance rather than support.
Dogecoin Trends and Kinetic Energy: Key Points
DOGE has broken through the declining wedge pattern and is currently reviewing the breakthrough area. The immediate resistance level of $0.07312 was rejected, causing the price to fall back into backtest territory. Closing prices above $0.07312 will open the door to $0.07946,$0.09250 and even psychological levels of $0.10. Closing below the $0.06875 support level changes the situation, and the next level of concern is $0.06767. In all time frames, long positions dominated recent liquidations, indicating where leverage risk is concentrated.
Dogecoin forecast: What does a declining wedge breakout back test mean?
DOGE compressed through most of July and August in a downward wedge, a pattern that usually signals an increase once prices decisively break through the upper trend line. 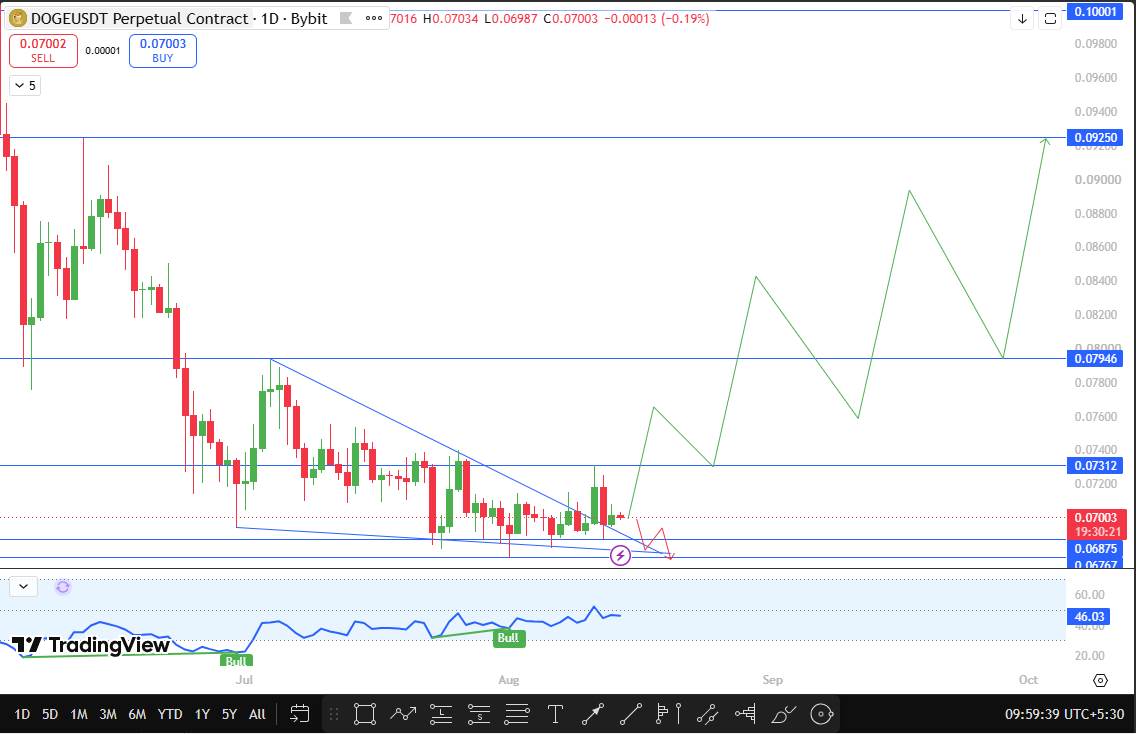 This is what happened here, with DOGE pushing above the wedge boundary and immediately encountering immediate resistance of $0.07312. The resistance level held, the price was rejected, and DOGE fell back to the same area where it had just broken through for backtesting. Such backtests are common after wedge breakthroughs and are often seen as a healthy pause rather than a failure, provided that the backtest can hold on rather than fall completely below the wedge structure.
The momentum oscillator built-in to the chart currently reads 46.03 and is now close to the midline after signaling a bullish signal in early August. The reading suggests that the market has not yet made strong commitments in either direction, which is consistent with the backtesting phase that DOGE currently appears to be in. If buyers step in from current levels and DOGE successfully closes above $0.07312, the trend will open up room for a series of near-term band highs and resistance levels. On the other hand, if the zone is not held and closes below $0.06875, momentum will shift back to sellers, pointing to support at the next band low.
Technology Outlook Snapshot
Signal: The shape is a descending wedge, a breakthrough has been confirmed, and is currently being tested back. The RSI, a momentum oscillator indicator, is 46.03, close to the midline, and there were bullish signals in early August. The immediate resistance level of $0.07312 has been rejected once. The immediate support level is $0.06875, with the backtest area as the focus. Trend: Neutral to cautiously bullish, provided that backtest support is held.
Support and resistance levels to be concerned about
Resistance level 3:$0.10000, psychological integer level,+42.80% compared to the current price
Resistance level 2:$0.09250, recent band high,+32.09%
Resistance level 1:$0.07946, recent band high,+13.47%
Immediate resistance level: $0.07312, wedge breakthrough backtest area, rejected once,+4.41%
Immediate support level: $0.06875, backtest support level, must be held to maintain the bullish structure,-1.83%
Support level 1:$0.06767, recent band low,-3.37%
Risk-reward table
Bullish situation: The trigger condition is that the closing price is higher than $0.07312, and the target positions are $0.07946,$0.09250, and $0.10000.
Bear scenario: The trigger is a closing price below $0.06875 and a target of $0.06767.
A close above $0.07312 is required to verify a bullish continuation, while a daily close below $0.06875 is a level that invalidates the current backtest.
Downside risks to be aware of
Wedge breakthroughs may indeed fail, especially in lower time frames, where volume may shrink rapidly. Traders should be wary of false breakthroughs near the $0.07312 area, as a brief price rise without a confirmed close is not an effective breakthrough.$ 0.10 Liquidity near equal-integer barriers tends to attract both real buying and stop-loss hunting activity, so price fluctuations near these levels can reverse sharply and quickly. Given that recent liquidations have clearly been biased towards long positions, any trader using leverage on DOGE should carefully control their positions and be aware that the wrong direction may lead to rapid liquidations.
What will change this dogcoin price forecast?
The entire forecast depends on how DOGE performs near the $0.07312 and $0.06875 levels on the next few daily candle charts. A confirmed daily closing price that breaks any boundary will be a trigger for re-examining this dogcoin forecast and adjusting the target accordingly. Until then, the retest area is still the price point that needs to be paid close attention to.
How Bitcoin sentiment affects DOGE
Historically, dogcoin has a tendency to fluctuate with broader market risk appetite, and Bitcoin sentiment has often set the tone for the performance of altcoins such as DOGE near key technological levels. A stable or bullish Bitcoin background will make it easier for DOGE to hold on to this backtest and push a break above $0.07312, while Bitcoin's risk-averse shift could put pressure on the $0.06875 support and increase the possibility of a decline towards $0.06767.
When will this dogcoin price forecast be reviewed?
If DOGE appears to confirm a daily close above $0.07312 or below $0.06875, or if no such close occurs in the next 24 to 48 hours, this forecast will be reviewed. At that time, the backtest area itself may need to be re-evaluated, and the market may enter a period of range volatility.
Glossary
Declining wedge: A chart pattern consisting of two convergent downtrend lines, usually regarded as a bullish reversal or persistent signal, which is confirmed once the price breaks the upper boundary.
Backtest: Prices return to the support or resistance level from which they previously broke out to confirm whether that level will now play the opposite role.
Liquidation: When a trader's losses exceed his margin, leveraged trading positions are forcibly closed, usually accelerating the price move towards liquidation.
Open interest: The total number of outstanding outstanding derivative contracts, used as a measure of capital inflows or outflows from the market.
Bullish, neutral and bearish scenarios
Bullish scenarios: The price held on to backtest support around $0.06875, and buyers re-entered, closing above $0.07312, opening the way to $0.07946 and eventually reaching the $0.09250 to $0.10 area.
Neutral scenario: Prices will continue to fluctuate between $0.06875 and $0.07312 in the next few trading days as the market waits for a clearer closing direction in either direction of the backtest range.
Bear scenario: Prices failed to hold the $0.06875 support level, closed below that level, and slid towards a low in the $0.06767 band, raising doubts about the effectiveness of the wedge break.
Disclaimer
This article is for information purposes only and should not be regarded as financial or investment advice. The cryptocurrency market is extremely volatile and prices can change rapidly. Analysts had no positions held at the time of release. Readers should conduct their own research and consult a qualified financial adviser before making any investment decisions.