Exchange Ranking
 Top Exchanges
 24h Volume Ranking
 Popularity Ranking
 Exchange BTC Balance
 Proof of Reserves
 Decentralized Exchanges
 Funding Rate
 Funding Heatmap
 Liquidation Data
 Max Pain
 Long/Short Ratio
 Whale L/S Ratio
 Binance/Okex/Huobi L/S
 Bitfinex Margin L/S
 ETF Tracker
 Solana ETF
 XRP ETF
 Hong Kong ETF
 Bitcoin Treasuries
 Crypto Reversal
 Ethereum Reserves
 HyperLiquid Wallet Analysis
 Hyperliquid Whale Watch
 Large Transactions
 On-chain Movement
 Bitcoin ROI
 Stablecoin Market Cap
 Options Analysis
 News
News Articles
 Economic Calendar
 Features
 Wallet
 Contract Calculator


 Security
 Collections
 Watchlist
 Following
 BTC
BTC Bitcoin prices returned to around $77,000 over the weekend and failed to hit $80,000 on Friday.
Bitcoin prices fell back to around $77,000 at the end of the weekend after an attempt to rebound to $80,000 was quickly blocked on Friday. BTC briefly surged to about $79,500 on Friday, but the gains were not sustained. Subsequently, the Bitcoin price fell back again to the US$77,000-US$77,500 range, and despite sharp intraday fluctuations, the price finally almost returned to its starting point. Market data showed Friday's highs were around $79,500-$79,700, while BTC was around $77,200 at the opening of Saturday.
This refusal to rise is crucial to today's Bitcoin price forecast. Bulls have shown they can still trigger a strong rally from the $76,000 area, but they have yet to prove they can maintain prices above $79,000 - 80,000. Since Saturday transactions typically lack the catalysts of traditional markets, and U.S. Bitcoin ETFs are closed on weekends, unless crypto-native capital flows trigger another wave of volatility surges, Bitcoin may enter a relatively calm consolidation period.
Bitcoin prices return to US$77,000 after Friday's failed rally
The 2-hour BTC/USDT chart shows how quickly Friday's rally disintegrated. Bitcoin has been on a downward trend after hitting about $82,283 in early September. A series of lower highs eventually pushed BTC into the $76,000 area, where buyers stepped in. There was a sudden rebound towards $79,500 on Friday. However, the price failed to stabilize above $79,000 and quickly returned to the $77,000 range.
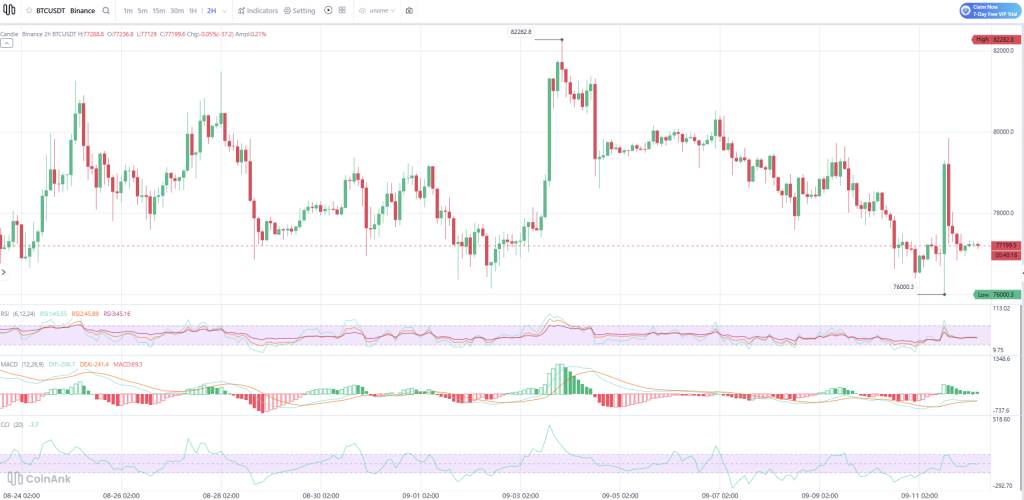 This provides a reference for several key price points worthy of attention on Saturday.
US$77,000 - 77,200 is the current immediate support area. Below it, the $76,000 - 76,500 is even more important because buyers have defended the area many times. The chart shows a recent low of around $76,000. If it falls below $76,000, the current structure will be weakened and the $75,000 area may be further exposed.
Resistance starts at US$77,800-US$78,000. Above it,$78,500 - 79,000 is the next hurdle, followed by the $79,500 area on Friday. The psychological barrier of $80,000 is still a bigger barrier. In the past few weeks, BTC has traded near the region many times, but has failed to establish sustained breakthroughs. Therefore, for bulls, the advance path is roughly as follows:
US$78,000 → US$79,000-US$79,500 → US$80,000 → US$82,000-US$82,300.
Before BTC began to recover these areas, Friday's rally looked more like a rejected recovery than the beginning of a confirmed bullish breakout.
Bitcoin momentum indicator performance diverges
The indicators below the chart do not currently provide strong bullish or bearish signals. RSI readings are concentrated between 45 - 46, keeping Bitcoin prices below the neutral 50 level but well above the oversold zone. This is consistent with price behavior: sellers still have a slight advantage, but Bitcoin has not stretched enough to make an immediate rebound inevitable.
MACD is slightly optimistic. The chart shows that the MACD histogram has returned to the positive region, with the latest reading of approximately 69. The MACD line also recovered above the signal line from its previous bear market stage. However, after Friday's initial rally, the green bar chart became much smaller. This suggests that bullish momentum from the $76,000 recovery is fading.
CCI tells a similar story. At around-7.7, the indicator is close to neutral, far from reaching the typical +100 overbought or-100 oversold area. Taken together, RSI, MACD and CCI point to a market that currently lacks strong directional momentum. This makes Bitcoin particularly likely to consolidate as it enters the weekend.
Bitcoin ETF outflow extended to four days
U.S. spot Bitcoin ETF continued to be under pressure on the eve of the weekend, although the latest outflow was significantly lower than the previous trading day. According to SoValue data, the fund recorded a consolidated net outflow of US$13.29 million on September 11, leaving it in a negative inflow state for four consecutive trading days. There was still some buying, and Morgan Stanley's MSBT recorded the largest single net inflow for the period, approximately $3.76 million. However, the inflow of each product was not enough to prevent the overall Bitcoin ETF community from ending the day with a negative value.
This four-day outflow streak was related to Bitcoin transactions around $77,000. At a time when BTC is already struggling to recover the US$79,000 - 80,000 area, continued ETF divestment may eliminate a source of demand in the spot market. However, the relatively modest outflow of $13.29 million on September 11 was far less worrying than the approximately $282.6 million divestments recorded the day before. This could indicate a significant cooling through the sell-off of ETF products before Friday's close, although one day alone is not enough to establish a new trend.
There are also significant differences between Bitcoin and the Ethereum ETF. Bitcoin products lost $13.29 million, while the U.S. spot Ethereum ETF attracted a net inflow of approximately $216 million. BlackRock's ETHA leads Ethereum products with a scale of approximately $149 million.
Today's Bitcoin Price Forecast (September 12)
The most realistic scenario on September 12 is a consolidation rather than another instant explosive market. Bitcoin opened at around $77,200 on Saturday, with RSI and CCI close to neutral, while MACD's recent bullish momentum is fading. Combined with weekend conditions, this provides a reasonable base scenario for BTC to hover between US$76,500 and US$78,500 for most of the day.
The first bullish signal will be an effective breakthrough of US$78,000. If BTC clears this level, US$78,500 - 79,000 will become the next target. A stronger weekend rally could bring back attention to Friday's high of $79,500, but Bitcoin may need to break past $80,000 before the short-term structure becomes more constructive.
The bearish scenario started with a loss of $77,000. This could lead BTC to move towards $76,500 and ultimately test the main $76,000 support level. If it falls below $76,000, the situation will be even more worrying and could open the door to $75,000.
However, for today, neither charts nor momentum indicators provide strong reasons for a major directional change. So, a reasonable base scenario for September 12 is: Bitcoin is mainly traded between $76,500 and $78,500, with $77,000 as immediate support, and $78,000 - 78,500 as the first meaningful resistance zone. Breaking through that range will change the outlook. Above $78,500, BTC may revisit $79,000 - 79,500; below $76,000, the risk of a deep correction will increase significantly.