Exchange Ranking
 Top Exchanges
 24h Volume Ranking
 Popularity Ranking
 Exchange BTC Balance
 Proof of Reserves
 Decentralized Exchanges
 Funding Rate
 Funding Heatmap
 Liquidation Data
 Max Pain
 Long/Short Ratio
 Whale L/S Ratio
 Binance/Okex/Huobi L/S
 Bitfinex Margin L/S
 ETF Tracker
 Solana ETF
 XRP ETF
 Hong Kong ETF
 Bitcoin Treasuries
 Crypto Reversal
 Ethereum Reserves
 HyperLiquid Wallet Analysis
 Hyperliquid Whale Watch
 Large Transactions
 On-chain Movement
 Bitcoin ROI
 Stablecoin Market Cap
 Options Analysis
 News
News Articles
 Economic Calendar
 Features
 Wallet
 Contract Calculator


 Security
 Collections
 Watchlist
 Following
 XRP
XRP XRP faces a "zeroing" warning? Chart truth may not be so pessimistic
Cryptocurrency analyst ChartNerd issued a seemingly extreme warning to XRP, but the chart behind the "will zero" forecast he quoted may not, at first glance, be as bearish as it appears.
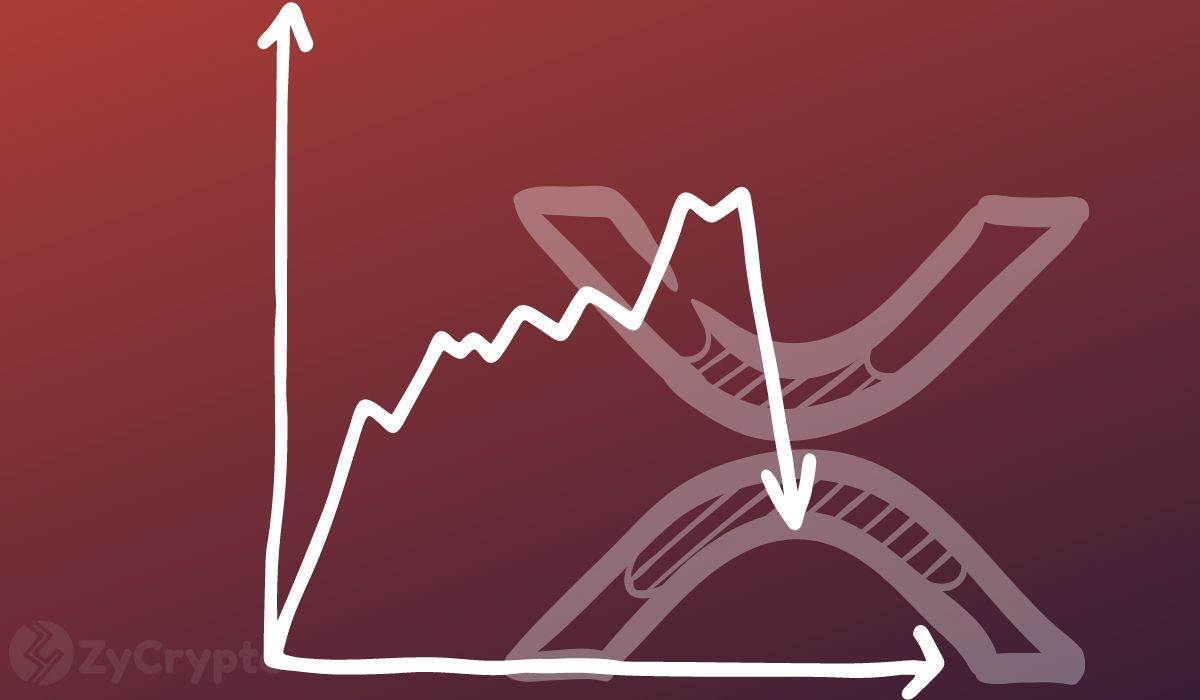
The analyst recently shared a long-term XRP price trend chart on the X platform, with an accompanying article saying: "XRP will still go to zero." This chart tracks XRP price movements over the forecast period from 2014 to 2028 and contains a significant downtrend line and a huge downward arrow.
However, this chart has one unusual detail: its price scale is inverted. In the chart, lower prices are displayed at the top of the vertical axis, while higher prices are displayed at the bottom. This feature changes the way we interpret trend lines and arrows.
What at first glance looks like a declining resistance line can actually be regarded as long-term support. The green mark on the chart also represents the multiple tests that the trend line has withstood, rather than being breached and failed. It is worth noting that the first structure covers most of XRP's price history from 2013 to 2017. XRP tested the trend line four times before breaking through gains during the 2017 bull market. Subsequently, the token's price climbed from a decimal point of less than a penny to more than $3.
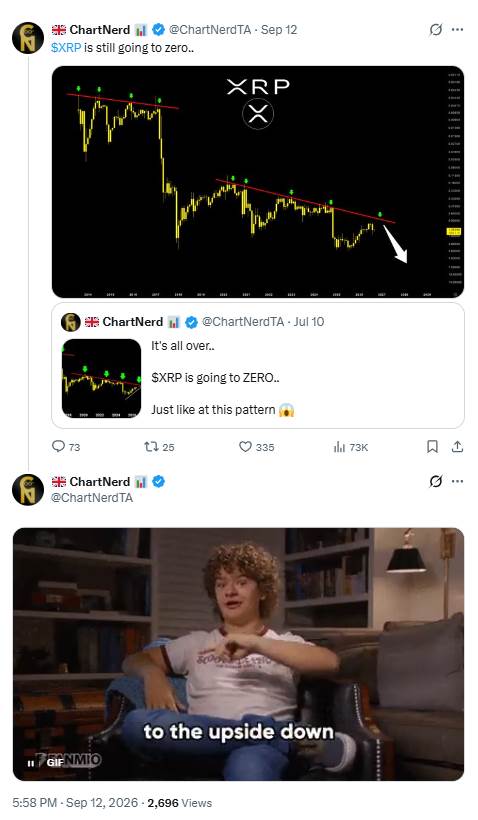
ChartNerd seems to attempt to draw an analogy between this historical form and the current structure of XRP.
The second trend line starts around 2019 and extends to 2027. It has been tested five times without a breakthrough. With XRP trading close to $1.38, the inverted chart points to the possibility of a potential move towards $7.50, which means there is huge upside from current levels.
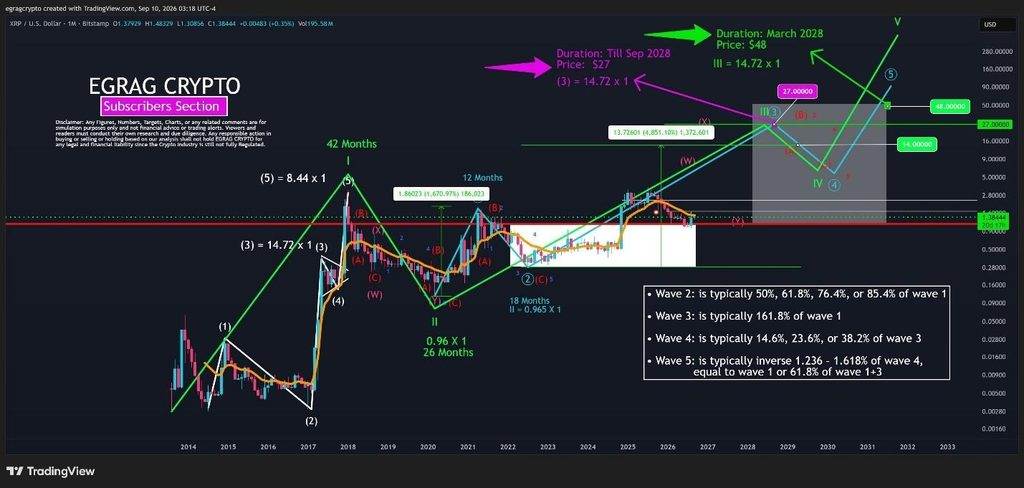
In addition, other analysts have set higher goals for XRP. Analyst Egrag Crypto recently updated his long-term Elliot Wave theory analysis, identifying $14,$27 and $48 as key forecast levels. His chart shows that the target of $27 will appear around September 2028, while the price of $48 will appear around March 2028.
The analyst acknowledged that these goals may seem unrealistic to some traders, but said they were based on his revised Elliott Wave structure, which incorporates XRP price movements over the past two to three years.
His views are in sharp contrast to ChartNerd's "zeroing" statement, although both analyses rely on technological forms to continue to evolve as expected.
Meanwhile, XRP, the fifth-largest cryptocurrency by market capitalisation, showed signs of rebound on Monday, giving bulls a hint of optimism despite a weekly decline of nearly 1%.
However, ChartNerd's "zeroing" statement was based on his personal interpretation of the technical form. This does not mean that the chart proves that XRP is destined to return to zero.
For XRP to go down that extreme downward path, the long-term support shown in the chart must expire. So far, according to his analysis, this pattern remains intact.
话虽如此,XRP已经拥有成熟的市场、显著的流动性,以及XRP Ledger上持续的活动,同时Ripple的相关发展和机构使用也在不断推进。这些因素并不能保证价格上涨,但它们使得价格真正跌至零成为一个更为极端的场景。
截至发稿时,XRP的交易价格为1.30美元,在过去24小时内上涨了2.29%。