Exchange Ranking
 Top Exchanges
 24h Volume Ranking
 Popularity Ranking
 Exchange BTC Balance
 Proof of Reserves
 Decentralized Exchanges
 Funding Rate
 Funding Heatmap
 Liquidation Data
 Max Pain
 Long/Short Ratio
 Whale L/S Ratio
 Binance/Okex/Huobi L/S
 Bitfinex Margin L/S
 ETF Tracker
 Solana ETF
 XRP ETF
 Hong Kong ETF
 Bitcoin Treasuries
 Crypto Reversal
 Ethereum Reserves
 HyperLiquid Wallet Analysis
 Hyperliquid Whale Watch
 Large Transactions
 On-chain Movement
 Bitcoin ROI
 Stablecoin Market Cap
 Options Analysis
 News
 Articles
 Economic Calendar
 Features
 Wallet
 Contract Calculator


 Security
 Collections
 Watchlist
 Following
 BTC
Bitcoin hovers around US$86,000, and U.S. stocks hit new highs weighing on market sentiment.
On Tuesday, Bitcoin prices fluctuated near the US$86,000 mark, with a relatively narrow trading range, while the U.S. stock market hit a record high. As Bitcoin failed to maintain momentum towards $87,000, traders pointed to short-term resistance in the order book-the impact of this microstructure is often as important as macro news when liquidity is concentrated at key levels.
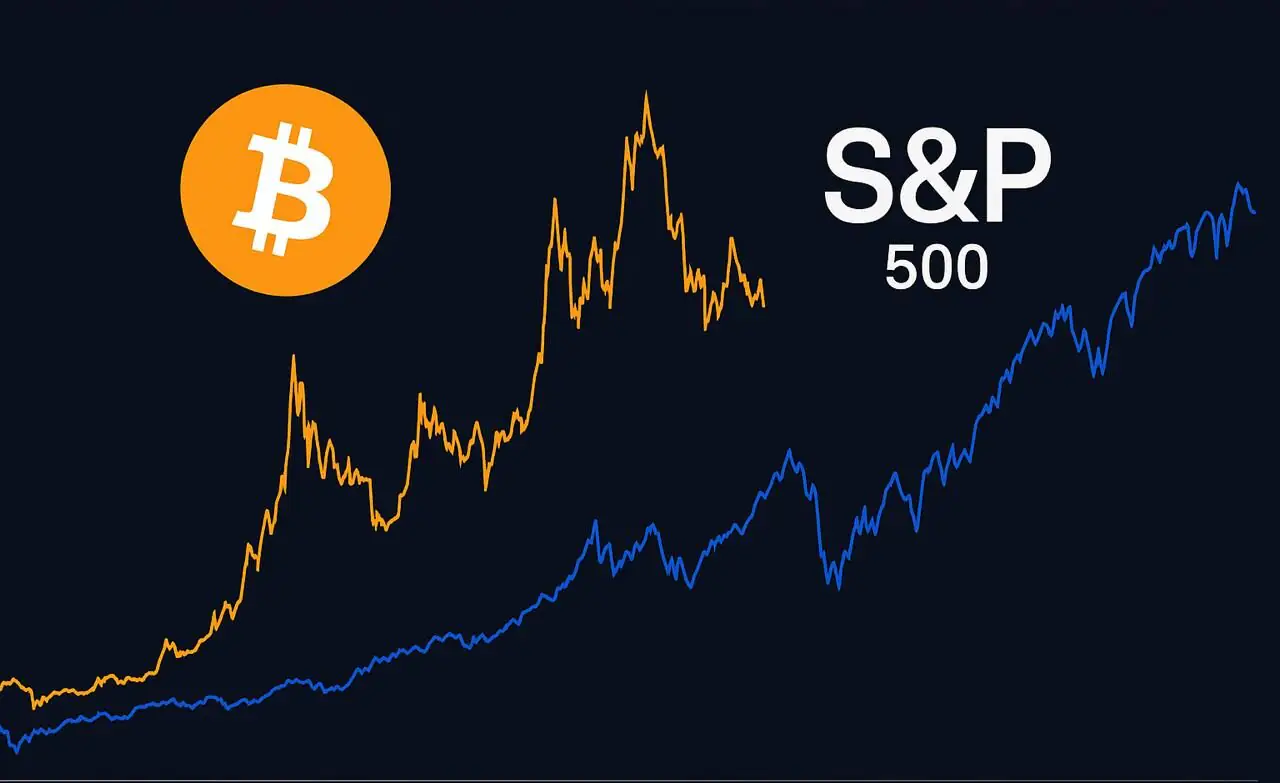
Meanwhile, closing records for major U.S. indices supported broader risk appetite. The S & P 500 index rose 0.8% to 7,835 points, and the Nasdaq 100 index and the Nasdaq Composite index also hit new highs, further confirming the close connection between large stocks and highly liquid crypto assets in the eyes of many investors.
Core Points
- Bitcoin is difficult to break through US$87,000, and the exchange order book shows significant sell order liquidity around this level.
- CoinGlass data shows that the area with the most concentrated clearing/liquidity is around US$87,000, and a "stepped" wall of selling orders has been formed at approximately US$86,500.
- On the technical side, the 21-day simple moving average (SMA) near US$83,500 remains the most watched support area in the near future.
- According to CryptoQuant, as of October 2, the positive correlation coefficient between Bitcoin and the S & P 500 index was 0.51, the highest level since early June this year.
- U.S. stocks are a key factor driving market sentiment. Mosaic Asset Company pointed out that although the S & P 500 index returned to historical highs, the market breadth remained relatively weak.
U.S. stocks are at historical highs, continuing to suppress Bitcoin's trading range
After failing to rush higher again on Monday, BTC/USD continues to try to rebound. According to TradingView data cited by Cointelegraph, despite recent strong performance, this rebound effort has not successfully broken through to a higher position.
After Wall Street opened, the stock market became the focus of attention throughout the day. The S & P 500, Nasdaq 100 and Nasdaq Composite all hit record highs, reaching 7,835, 31,312 and 27,683 respectively. The magnitude of the rally since spring has been particularly impressive: Kobeissi Letter pointed out that the S & P 500 has risen 24% since March 30, equivalent to approximately $71.3 trillion in value growth.
Mosaic Asset Company interprets current stock market momentum from the perspective of changes in Fed policy expectations. The company said in an analysis on Tuesday that a cooling in market expectations for a rate hike in the fourth quarter of 2026 could provide impetus for a continued rebound. At the same time, the company emphasized that market breadth remained weak-only 25% of stocks traded above its 50-day simple moving average last week, while technology stocks continued to lead the rally.
This breadth dynamic is crucial to cryptocurrency observers because it affects the persistence of "risk-hungry" funds. If stock market gains rely too much on a few winners, the market may be more sensitive to any changes in interest rate expectations-conditions that often translate into liquidity-driven speculation in Bitcoin.
Increased correlation with stock markets, but Bitcoin still needs its own catalyst
CryptoQuant's data shows that Bitcoin's relationship with the S & P 500 is consolidating, even if this does not translate into a clear breakthrough for BTC. CryptoQuant's analysis showed that as of October 2, the correlation coefficient between Bitcoin and the S & P 500 index was 0.51, described as the highest level since early June.
This is significant to investors because correlation is a useful (although imperfect) measure of how "macro liquidity" guides both markets. However, correlation does not automatically resolve short-term resistance. Even if stocks perform well, Bitcoin may remain range-bound, especially when traders actively defend against specific price levels on derivatives and spot order books.
Tuesday's trading pattern seemed to fit this description: stock market conditions provided background support, but BTC's ability to break through highs was constrained by concentrated liquidity near $87,000.
US$87,000 under sell pressure; support focuses on 21-day moving average
Although Bitcoin is trying to return to $87,000, resistance from the top still exists. Cointelegraph pointed out that the "sell order liquidity" concentrated in this range in the order book is a key factor limiting the increase in this period.
CoinGlass futures data increases the granularity of detail. Data showed that the area with the most concentrated liquidity on Tuesday was around $87,000, and showed a stepped sell order structure in a range extending downward to approximately $86,500. In practice, this "stepped" structure will slow the upward trend by forcing buyers to absorb selling pressure in multiple price steps until the market finds acceptance at a higher price.
In terms of downside risks, market participants pay close attention to recent major trend reference points. Keith Alan, co-founder of Material Indicators, pointed out that support is around $83,500-Bitcoin's simple 21-day moving average. Alan said the price was last traded on September 18, positioning it as a key area to determine whether the current range extends or turns into a deeper correction.
Alan's broader framework also cites specific levels of failure and trend confirmation. In an analysis posted on Platform X, he pointed out that the focus was whether buyers could clear the monthly signal failure threshold of $87,375, and then discussed a scenario where recovering and retesting the annual opening price of $87,496 would strengthen the case for a more durable trend above $91,540.
These levels do not guarantee direction, but they clarify the basis for which traders may use to build risk in the short term-especially in markets where pools of liquidity around integer barriers and technical averages dominate price movements.
Follow-up focus: Market breadth, liquidity wall and 21-day moving average
As the U.S. stock market is still trading at historical highs and the correlation between Bitcoin and the S & P 500 index increases, the next development in BTC may come more from whether the market structure can clear the $87,000 liquidity pocket without quickly reversing than from comments on interest rates. Traders may continue to focus on subsequent movements above $87,375 and whether $83,500 (21st SMA) can continue to serve as the nearest technical line of defense.