Exchange Ranking
 Top Exchanges
 24h Volume Ranking
 Popularity Ranking
 Exchange BTC Balance
 Proof of Reserves
 Decentralized Exchanges
 Funding Rate
 Funding Heatmap
 Liquidation Data
 Max Pain
 Long/Short Ratio
 Whale L/S Ratio
 Binance/Okex/Huobi L/S
 Bitfinex Margin L/S
 ETF Tracker
 Solana ETF
 XRP ETF
 Hong Kong ETF
 Bitcoin Treasuries
 Crypto Reversal
 Ethereum Reserves
 HyperLiquid Wallet Analysis
 Hyperliquid Whale Watch
 Large Transactions
 On-chain Movement
 Bitcoin ROI
 Stablecoin Market Cap
 Options Analysis
 News
 Articles
 Economic Calendar
 Features
 Wallet
 Contract Calculator


 Security
 Collections
 Watchlist
 Following
 SHIB
SHIB is approaching $0.000060, and trend line convergence indicates direction choice.
After experiencing the strong rise in September and previous breakthroughs, the price of SHIB is gradually approaching the $0.000060 mark, when multiple trend lines are converging. The Relative Strength Index (RSI) remains above 50, while the slightly negative MACD histogram shows a cooling in short-term momentum during recent consolidation.
If the daily chart can successfully break through the daily trend line, it will further confirm the bull market pattern; otherwise, if the trend line fails, the current technical architecture will lack support. As prices consolidate below resistance, SHIB is at a key technical decision point. The strong advancement and breakthrough stage after the previous low rebound, coupled with the current convergent trend line pattern, have jointly shaped the market's next potential trend.
Accumulation structure is built and ready to go

BezosCrypto described the early trend of SHIB as a parabolic accumulation stage. Relevant analysis pointed out that prices have broken through resistance and shown stronger upward momentum, viewing previous obstacles as potential launch platforms after repeated rises.
The chart provided byshows that the market went through a long period of accumulation before a steeper rise in September. Subsequently, prices moved upwards among multiple resistance areas. After the latest round of expansion, the market entered a subsequent consolidation phase.
The latest daily chart shows that SHIB has entered consolidation after a strong rise in September. The price briefly rose above $0.000060 before retreating to a narrower trading range. Currently, lower higher points and higher lower points are forming a boundary of convergence.
This pattern forms a tightening symmetrical triangle below the main resistance zone. The downward trend line limits the room for further rebound around $0.000060. At the same time, the upward downward trend line plays a supporting role in the consolidation process.
$0.0000060 remains the main resistance level
Currently showing a SHIB price of approximately $0.00000572. Prices remain below resistance but remain above the upward supporting trend line, keeping the market within a tightening technical pattern.
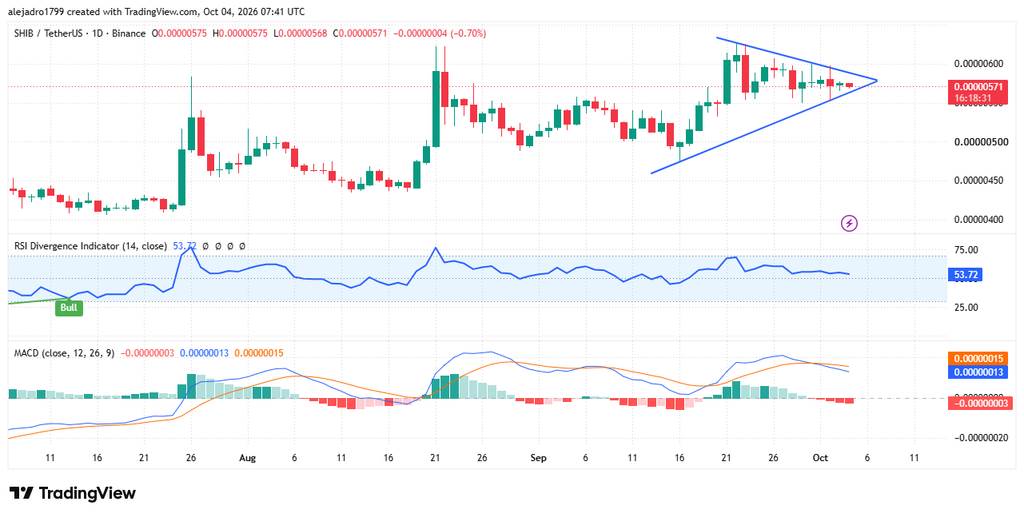
Breaking through the downtrend line will strengthen the current bullish structure and push prices beyond existing consolidation boundaries. If rejected, the triangular form remains intact.
The relative strength index (RSI) on the daily chart currently reads at 54.04. This reading indicates that kinetic energy remains above the neutral level of 50 and has not yet entered the traditional overbought area. The early strength of the RSI was accompanied by stronger gains in the chart, and then the indicator cooled down as prices entered consolidation. Current readings show positive kinetic energy, but no over-extension.
MACD signal shows kinetic energy cooling
在当前结构内,MACD 提供了更为谨慎的信号。MACD 线仍位于其信号线下方,所示图表中的柱状图也略微为负。这些读数表明,在九月上涨之后,短期动能有所降温。尽管价格走势依然较强且上升趋势线保持完好,但指标呈现出混合的技术画面。
向上突破下行趋势线将确认突破态势。RSI 若出现更积极的动能,可能会进一步支持上方的上涨空间。若无确认,阻力位可能继续限制向上的尝试。
上升的趋势线仍是当前价格下方的关键结构性支撑。若有效跌破该线,将削弱当前的形态结构,这种走势可能使市场注意力重新回到早期的盘整区域。
就目前而言,SHIB 的特征更多是压缩而非确定的延续。$0.0000060 区域仍是需要关注的主要阻力位。下一次决定性动向将决定该结构的走向。