Exchange Ranking
 Top Exchanges
 24h Volume Ranking
 Popularity Ranking
 Exchange BTC Balance
 Proof of Reserves
 Decentralized Exchanges
 Funding Rate
 Funding Heatmap
 Liquidation Data
 Max Pain
 Long/Short Ratio
 Whale L/S Ratio
 Binance/Okex/Huobi L/S
 Bitfinex Margin L/S
 ETF Tracker
 Solana ETF
 XRP ETF
 Hong Kong ETF
 Bitcoin Treasuries
 Crypto Reversal
 Ethereum Reserves
 HyperLiquid Wallet Analysis
 Hyperliquid Whale Watch
 Large Transactions
 On-chain Movement
 Bitcoin ROI
 Stablecoin Market Cap
 Options Analysis
 News
 Articles
 Economic Calendar
 Features
 Wallet
 Contract Calculator


 Security
 Collections
 Watchlist
 Following
 XRP
Analysis of the trend of XRP price after a sharp sell-off
The XRP price has stabilized after this week's sharp sell-off. As of press time, the trading price of the token is approximately US$1.40. Earlier this week, XRP prices briefly fell to a low range of $1.30, before buying stepped in. The latest two-hour chart shows that XRP is trying to rebound, but prices are still well below the $1.48 -1.50 area that previously served as support.
For October 10, the main question now is: Can this rally develop into a larger rebound, or is XRP prices just taking a temporary break before falling further?
Kinetic indicators show signs of improvement
The first positive signal comes from the Relative Strength Index (RSI). Chart data shows:
- Short-term RSI: 61.58
- Medium-term RSI: 53.54
- Long-term RSI: 46.99
- Commodity Channel Index (CCI): 109.13
Short-term RSI has risen above 60, indicating that buyers have regained some momentum amid the recent oversold situation. The medium-term RSI has also recovered above 50, although long-term readings remain below that level. This suggests that short-term market conditions are improving, but a complete reversal of the trend has not yet been confirmed.
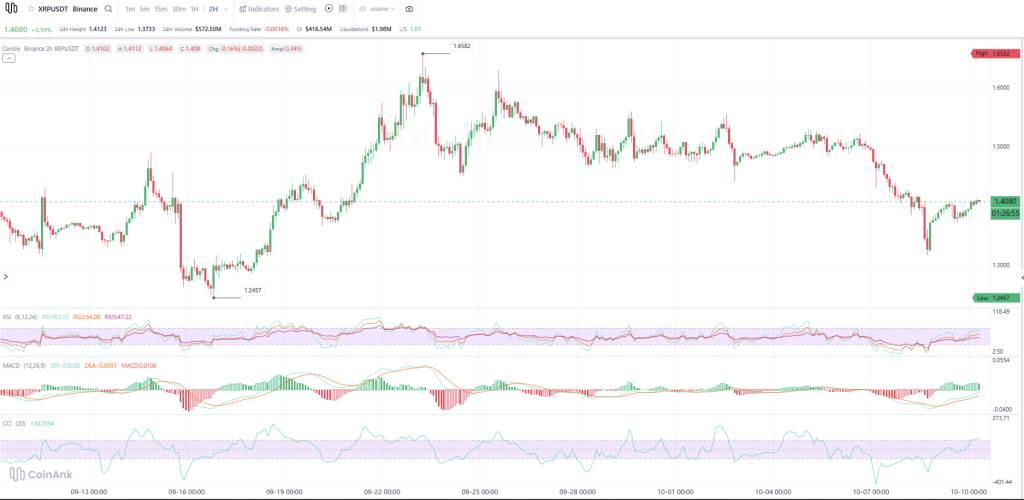 The Commodity Channel Index (CCI) has exceeded 100, further indicating that the rally has substantial momentum. However, the risk is that XRP is approaching its first resistance zone. If buyers are unable to push prices beyond the zone, these indicators may cool down quickly.
The MACD indicator showed a more positive trend
The MACD indicator also improved significantly. The bar chart turned positive and the fast line has crossed the signal line after experiencing a sharp bearish move earlier in the week. This supports the view that selling momentum is weakening. Still, the two lines of MACD are still close to the zero-axis region, so the current pattern is more in line with the characteristics of an early recovery than a confirmed bullish trend. Until prices recover higher resistance, the technical pattern will not strengthen substantively.
XRP Support and Resistance Analysis
XRP is currently trading close to US$1.40-US$1.41. The first resistance level is around $1.42. If we can break through the area cleanly, the XRP price is expected to test US$1.45. The more critical resistance level remains in the US$1.48-US$1.50 range, with prices selling off after several days of consolidation.
On the downside, US$1.37 -1.38 is the first support level. After falling below this range, US$1.33 -1.35 will once again become an important support. Recent rebound performance in the area shows buyers are willing to defend. If support at $1.33 is lost, the market's focus will shift to $1.30 and may then hit near the September low of $1.25.
XRP price trend forecast on October 10
Possible scenarios The bullish rebound in the key XRP price continues, with XRP breaking through the immediate resistance level of US$1.42, followed by a neutral rebound of US$1.45 -1.48, and then entering a consolidation period. US$1.37 -1.42 The bearish rebound failed, and the seller returned to US$1.33 -1.35, followed by US$1.30. If XRP can break through and stand above US$1.42, the bullish scenario will be strengthened. This could extend the recovery to $1.45, with $1.48 becoming a more challenging test target. In a neutral scenario, XRP prices will remain between approximately $1.37 and $1.42 as traders wait for the broader cryptocurrency market to choose direction. If XRP falls back below $1.37, bearish scenarios begin to emerge. This will put US$1.33 -1.35 in the spotlight again. Once the area is lost, US$1.30 will face a test.
For October 10, US$1.42 is the key upside target. Although momentum indicators have improved significantly, XRP still needs to convert this rally into a higher high before the short-term structure can credibly turn bullish.