Exchange Ranking
 Top Exchanges
 24h Volume Ranking
 Popularity Ranking
 Exchange BTC Balance
 Proof of Reserves
 Decentralized Exchanges
 Funding Rate
 Funding Heatmap
 Liquidation Data
 Max Pain
 Long/Short Ratio
 Whale L/S Ratio
 Binance/Okex/Huobi L/S
 Bitfinex Margin L/S
 ETF Tracker
 Solana ETF
 XRP ETF
 Hong Kong ETF
 Bitcoin Treasuries
 Crypto Reversal
 Ethereum Reserves
 HyperLiquid Wallet Analysis
 Hyperliquid Whale Watch
 Large Transactions
 On-chain Movement
 Bitcoin ROI
 Stablecoin Market Cap
 Options Analysis
 News
 Articles
 Economic Calendar
 Features
 Wallet
 Contract Calculator


 Security
 Collections
 Watchlist
 Following
 ZEC
Today's Zcash Price Forecast: Market Overview
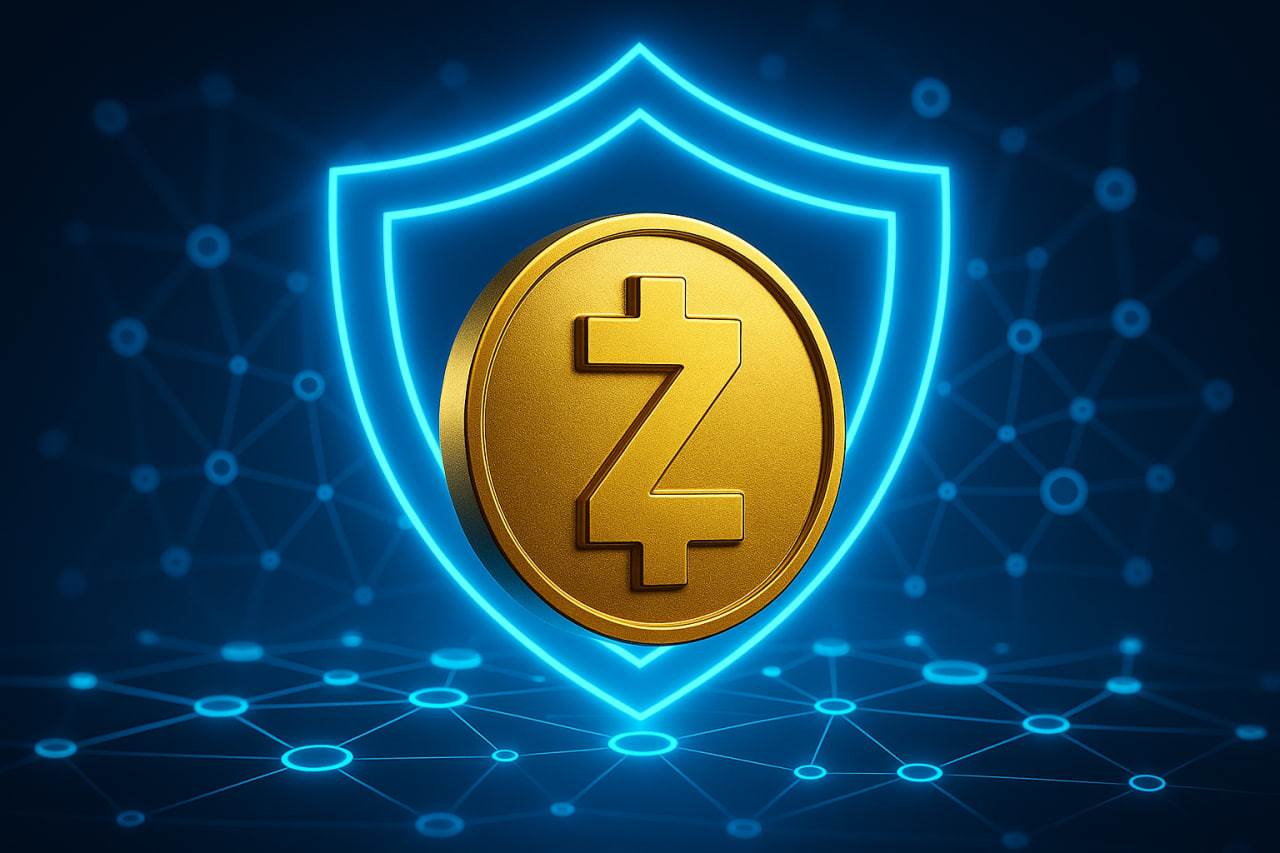
Zcash (ZEC) traded today at US$1,218, down 0.45%. A trader on platform X said ZEC had soared from more than $400 to $1,700, and anyone who missed this wave is closely watching the current correction. The trader currently refers to the current region as the "critical range of success or failure." This Zcash price forecast covers this view, clearing data, and key levels on the chart.
Market Data Deadline: October 10, 2026
Indicator Value Price $1,218.36 24-hour change-0.45% Zcash Latest News: Developers aim to launch anti-quantum payments in January 2027
A Gemini article published on the X platform pointed out that the Zcash development team's goal is to launch anti-quantum payments in January 2027. "Quantum resistant" means that the system can withstand security threats that future quantum computers may pose, because quantum computers may crack some of today's encryption algorithms.
Zcash News Today: Traders call US$1,050 to US$1,100 the "make or break" range
An article on the X platform pointed out that ZEC has pulled back to a key support area between US$1,050 and US$1,100. Support refers to the price area in which buyers have previously intervened. The trader said that if buyers can hold on to the area, another round of gains may occur; if it breaks below, bears will have an opportunity.
这是单一交易者的观点。CoinGabbar无法独立验证该 setups 的实际发展情况。
加密货币新闻:ZEC清算数据显示空头遭受重创
当交易所因交易者无法承担损失而强制平仓杠杆交易时,即发生清算。做多(Long)是押注价格上涨,做空(Short)是押注价格下跌。
时间窗口总清算金额多头清算空头清算 1小时$9.66K$1.22$9.66K 4小时$228.96K$57.40K$171.56K 12小时$967.55K$536.36K$431.19K 24小时$4.18M$1.50M$2.69M 来源:Coinglass期货数据。由于源数据对每个数字进行了四舍五入,总和可能与多空之和略有不同。
空头占24小时总量的约64%,约占4小时总量的75%。12小时窗口则相反,多头占比约55%。价格上涨会迫使空头平仓,因此近期的混合数据符合反弹的特征。然而,这些金额相对较小,因此单独依靠这些数据得出的结论有限。
Zcash价格图表:技术分析
ZEC在9月份上涨,并在9月下旬触及接近1,700美元的峰值。随后回落,在1,272.56美元附近交易了数天,并于10月8日以急剧下跌的方式跌破该水平。低点接近1,100美元。
The latest 4-hour K-line opening price is US$1,214.06, with fluctuations ranging from US$1,213.92 to US$1,221.38, and currently closes at US$1,218.36. Current prices range from US$1,100.19 to US$1,272.56, with a spread of approximately US$172.
The path drawn on the chart shows that prices need to break through US$1,272.56, US$1,501.51 and US$1,700.00 in turn, with US$2,000.00 being the highest target marked.
ZEC Support: Areas where the correction may stabilize
US$1,100.19 is the first support level. It is on the edge of the trader's area and coincides with mid-September lows. If this support fails, the lower level of the next marker is US$1,000.00.
ZEC Resistance Level: The target level in this ZEC forecast
US$1,272.56 is the most recent resistance level, which is the area where sellers have previously suppressed prices. ZEC was held near this position for several days until October 8. Above it, the chart marks $1,501.51, then $1,700.00, and finally $2,000.00.
Zcash Prediction: Trigger Conditions and Invalid Cases
Scenario trigger conditions possible outcome invalid conditions rebound continues to stabilize above US$1,100.19 and closes above US$1,272.56 moving towards US$1,501.51, closes below US$1,100.19 range fluctuates between US$1,100.19 and US$1,272.56 Trading forms a bottom before the next change, closes out of this range, declines resume, closes below US$1,100.19 slipped to 1, The closing price of $1,100.19 refers to the price at the end of the K-line. Traders often use close prices rather than short hatches (thin spikes that quickly reverse).
Zcash Price Forecast: Can ZEC reach US$2,000?
ZEC first needs to break through US$1,272.56, US$1,501.51 and US$1,700.00. A rise from $1,218.36 to $2,000.00 means an increase of about 64%, while a return to $1,700.00 means an increase of about 40%. As prices are still below $1,272.56, the chart does not yet show this trend.
Zcash 2026 Price Forecast: Expert Opinion
According to CoinGabbar analysts, the "make or break" label is consistent with the current chart pattern because prices are between two clear levels and there is no confirmed direction.
The next few 4-hour K lines around $1,272.56 and $1,100.19 will show which side dominates. Until one of these levels is broken, ZEC is likely to continue to fluctuate within that range.