Exchange Ranking
 Top Exchanges
 24h Volume Ranking
 Popularity Ranking
 Exchange BTC Balance
 Proof of Reserves
 Decentralized Exchanges
 Funding Rate
 Funding Heatmap
 Liquidation Data
 Max Pain
 Long/Short Ratio
 Whale L/S Ratio
 Binance/Okex/Huobi L/S
 Bitfinex Margin L/S
 ETF Tracker
 Solana ETF
 XRP ETF
 Hong Kong ETF
 Bitcoin Treasuries
 Crypto Reversal
 Ethereum Reserves
 HyperLiquid Wallet Analysis
 Hyperliquid Whale Watch
 Large Transactions
 On-chain Movement
 Bitcoin ROI
 Stablecoin Market Cap
 Options Analysis
 News
News Articles
 Economic Calendar
 Features
 Wallet
 Contract Calculator


 Security
 Collections
 Watchlist
 Following
 BTC
BTC Bitcoin has climbed from a 2026 low (about $57,000) to about $79,000, and a strong weekly rebound has changed the discussion about BTC. During the strongest period in recent markets, prices rose more than 25%, and regained technical levels that had not been reached for months.
This recovery raises a thorny question: Is the Bitcoin bear market really over? Or is BTC just staging another strong rally in a larger bearish structure?
Currently, multiple indicators support bullish views. Bitcoin has regained its main moving average, demand for spot Bitcoin ETFs has rebounded, large households have increased hoarding, and broader liquidity conditions have improved. However, other data still warn of caution as market sentiment heats rapidly, spot volume remains weak, and Bitcoin has yet to break through key resistance levels that have suppressed its price for most of 2026.
We provided existing market data to ChatGPT and Claude to see if these two AI models would reach the same conclusion. Their answers are similar, although the reasoning behind them is not exactly the same.
Bitcoin bear market indicators are beginning to show healthier signs
Large price increases alone do not confirm the end of the Bitcoin bear market. During bear markets, there are often strong rallies, followed by prices falling again.
The following technical and market indicators can provide a clearer picture of the current situation.
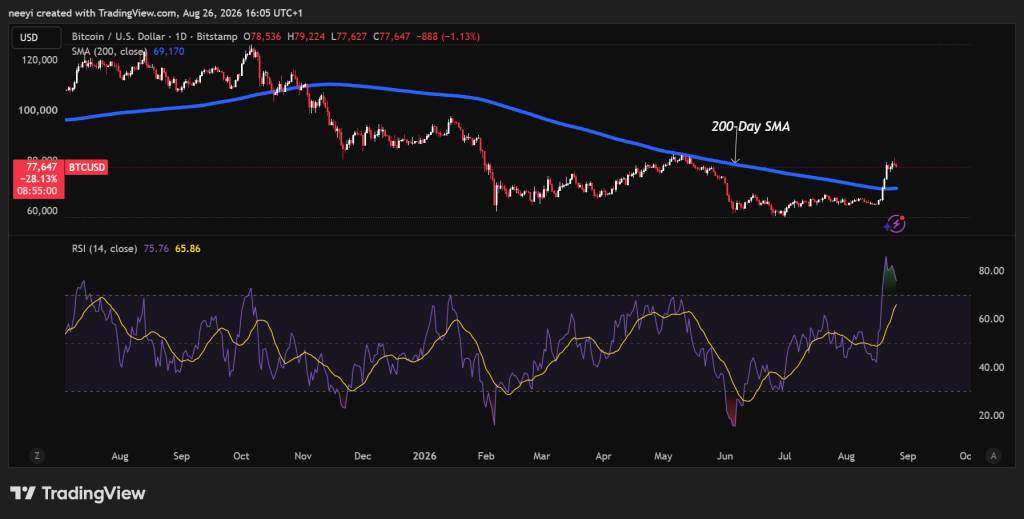
Bitcoin's recovery of its 200-day moving average is an important development. Prolonged periods below this level usually point to weak market structure. Continuing to stand firm can serve as evidence that buyers have regained greater leadership.
Market structure is equally important. A true trend reversal usually requires Bitcoin to stop hitting lower highs and lower lows. BTC ultimately needs to establish higher highs and higher lows over a larger time frame.
Other useful indicators include:
Weekly RSI: rallies above 50 after deeply oversold conditions can support the argument of a larger trend reversal.
MVRV Z-Score: has rebounded from the negative area to above 1, which may indicate that the recruitment phase is coming to an end.
Exchange Reserves: Falling bitcoin balances on exchanges can reduce the ready-to-use seller supply.
Spot volume: When real spot activity increases, a sustainable recovery usually becomes stronger.
Fear and Greed Index: Distance from "extreme fear" areas can support recovery, but excessive "greed" can pose short-term risks.
The current situation provides multiple positive readings, but is not a perfect confirmation.
Indicator| Bear market conditions| bullish reversal condition| Current reading
Price structure| Lower highs and lows| Higher highs and lows| Improving
200-day moving average| Prices remain below| Prices stay above| Bullish
ETF demand| continued outflow| Strong spot inflow| Bullish
Large holdings| distributed| sucking|
Market sentiment is improving| extreme fear| Neutral to greedy| Possible overheating
Spot volume| weak| continued strength| This mixed signal of still weak
is precisely why the next step of Bitcoin's price movement is crucial.
ChatGPT believes that the probability that Bitcoin has bottomed out is 70% to 75%
ChatGPT's answer is biased towards bullish, although the model does not explicitly declare that the entire cryptocurrency market has entered a confirmed bull market. The conclusion is that Bitcoin has likely exited the bear market of 2025 - 2026 and entered an early recovery phase.
Multiple evidence supports this conclusion.
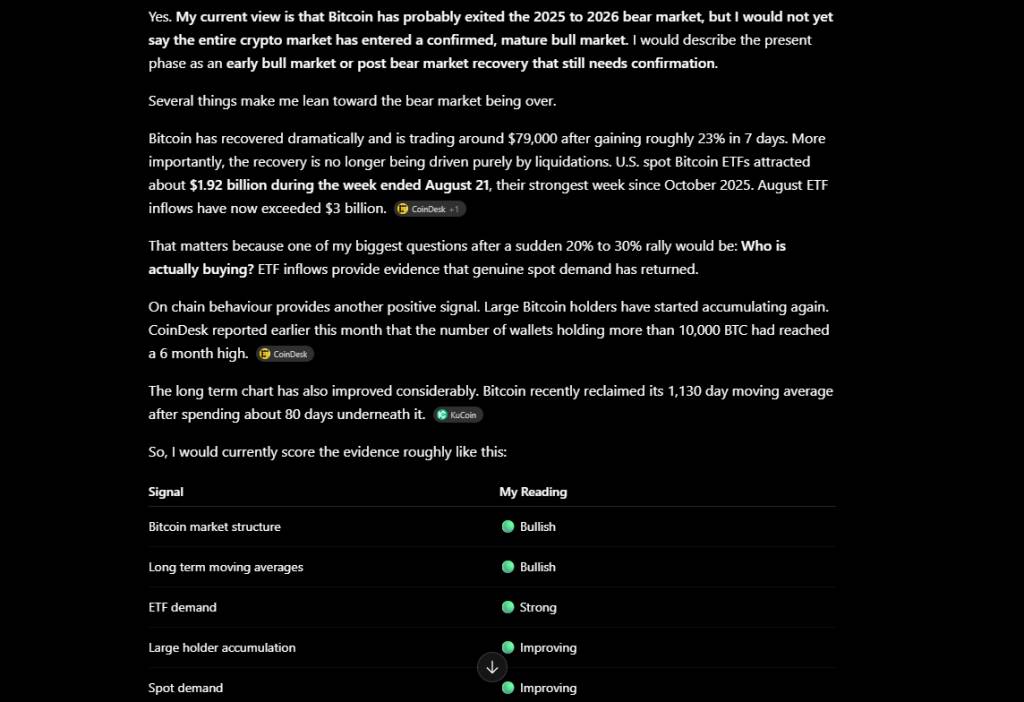
Bitcoin has recently traded at about US$79,000, after rising about 23% in seven days. More importantly, during the week ended August 21, the U.S. spot Bitcoin ETF recorded a net inflow of approximately $1.92 billion. This was the strongest weekly result since October 2025, and total inflows in August exceeded US$3 billion.
Large household activities have also improved. The number of addresses holding more than 10,000 BTC recently reached a six-month high, proving that large households have begun to attract funds again.
ChatGPT interprets the evidence as follows:
Signal| Interpretation of ChatGPT
Bitcoin market structure| Bullish
Long-term moving average| bullish
ETF Demand| Strong
Large companies attract funding|
Spot demand is improving|
Market sentiment is improving| Possible overheating
Macroliquidity| Improved but complex
Altcoin confirmation| Not convincing
The biggest concern is the speed of the recovery. The Fear and Greed Index climbed from 27 on August 12 to 74 on August 25, before falling back to around 65. This rapid change may make Bitcoin vulnerable to a correction, even if the larger recovery trend remains unchanged.
Therefore, ChatGPT estimates a 70% to 75% probability that the Bitcoin bear market bottom has passed . The model has low confidence in the view that "the entire cryptocurrency market has entered a broad bull market."
Claude stated that the Bitcoin bear market has likely bottomed out, but it must be confirmed
After reviewing the same overall evidence, Claude reached a similar conclusion. The conclusion is that cautiously and tentatively affirms , although Claude believes that the current breakthrough is still in its early stages and cannot be fully confirmed.
The 200-day moving average played an important role in Claude's analysis. Bitcoin remained below this indicator for about 270 consecutive days before recovering it (around August 21).
Claude also pointed out the traffic of spot Bitcoin ETFs. Previously, monthly ETF activity had generated an outflow of about $2.4 billion, and then almost $1.92 billion returned within a week.
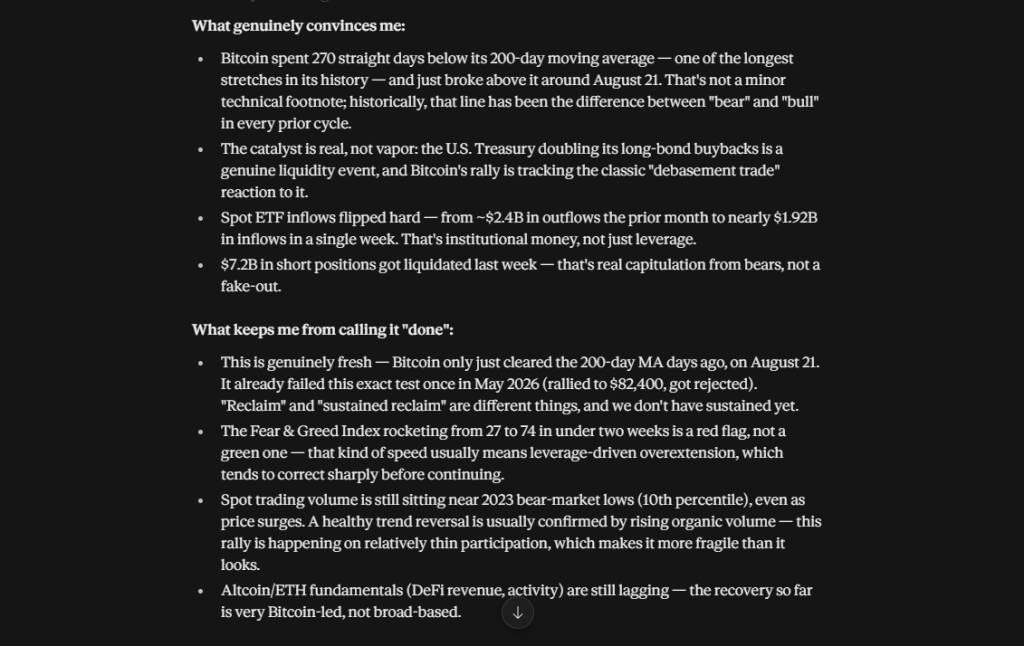
Another factor is that an estimated $7.2 billion of short Bitcoin positions were liquidated during the recent rally. The liquidation helped clear excessively bearish leveraged positions from the market.
Claude remains cautious for several reasons. Bitcoin also tried to break the 200-day moving average in May 2026, when the price fell again after reaching about $82,400. As a result, the current breakthrough will take time to prove that buyers can hold on to recovered prices.
In addition, spot trading volumes are still close to levels seen during the 2023 bear market. This weakness makes the current recovery in Bitcoin prices less convincing than a trend supported by widespread spot participation.
Claude finally described the current situation as: The Bitcoin bear market is likely to have bottomed out and a new upward trend has begun, but its persistence still needs to be proven .
ChatGPT and Claude agree on the bottom issue, but differ on the degree of confirmation
The biggest consensus between the two AI models is the possible bottom of Bitcoin . Neither model believes that the recent rebound in Bitcoin prices is meaningless. They all view recovered moving averages, ETF inflows and improved fundraising data as real improvements.
Their main disagreement is how much confirmation these indicators provide.
Question| ChatGPT |Claude
Bitcoin may have bottomed out? | is| Is the
bear market definitely over? | Not fully confirmed| Confirm too early
Are ETF inflows important? | very important| Very important
Is it important to regain the moving average? | is| Extremely important
Are emotions worried? | is| Is
Spot trading volume a concern? | medium| Main Concerns
Is a widespread cryptocurrency bull market confirmed? | no| No
ChatGPT places more emphasis on the combination of ETF demand, fundraising and improved market structure. Claude emphasized whether Bitcoin could remain above the 200-day moving average and whether spot trading volume improved.
Therefore, the two models reached similar conclusions through slightly different paths.
Bitcoin prices must exceed $83,000 to strengthen bullish reasons
Bitcoin's chart provides the final piece of the puzzle for this debate. Last week was one of the strongest periods for BTC in 2026. Bitcoin gained more than 25% in a week before slowing down around the main resistance level.
The current price trend has been much calmer. BTC did not continue to explode, but prices remained above last week's close. Larger structures are particularly important here.
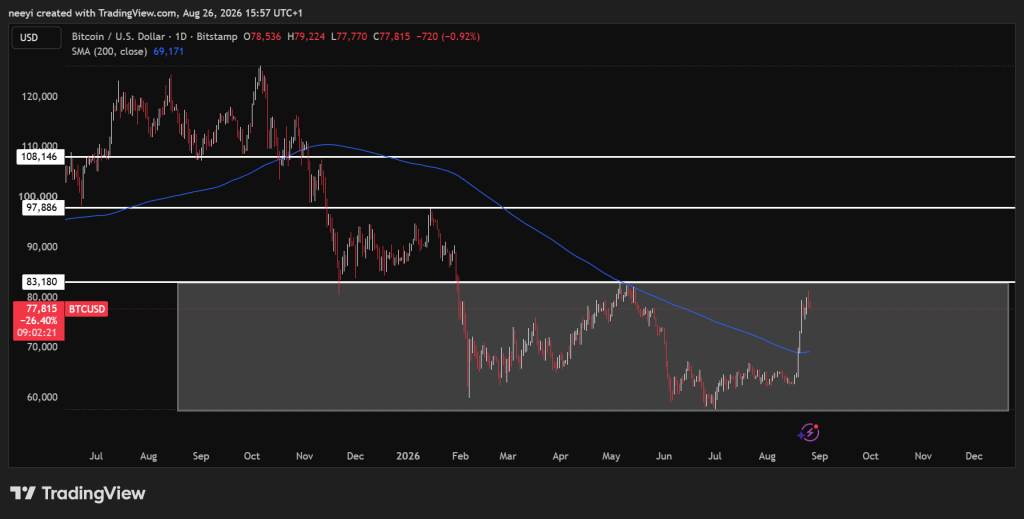
Bitcoin will be below $82,000 for most of 2026. The majority of transactions occurred between approximately $60,000 and $79,000, while the $82,000 to $83,000 area repeatedly prevented further upward attempts.
This makes the US$82,000 to US$83,000 area a significant resistance area that needs attention 。A clean break through the zone could push Bitcoin towards $84,000 and produce its first convincing move out of the 2026 range since January. Such a breakthrough could open space for a path to about $98,000. Bitcoin's breakthrough of $98,000 will make the $100,000 area within reach again.
A bearish scenario is still possible. Being rejected again around $82,000 to $83,000 may keep BTC trapped within the same wide range. Bitcoin may then test the $70,000 region again, the lower $70,000 region, or even some of the $60,000 region.
During any pullback, the recovered 200-day moving average becomes important because buyers may try to hold on to it as support.
Therefore, there are several key levels for Bitcoin that may determine its next move:
US$82,000 - 83,000: Control the main resistance in the 2026 range.
US$84,000: Breaking through this area will strengthen the bullish structure.
US$98,000: If BTC goes out of range, the next major upside area.
US$70,000 region: Important support level in the event of another correction.
US$60,000 region: Deeper support in the broader 2026 range.
US$57,000: Major 2026 lows that bulls are reluctant to hit again.
Both ChatGPT and Claude tend to believe that a bear market bottom for Bitcoin has been formed. But both models believe that the existing evidence is not strong enough to declare a fully established bull market for cryptocurrencies. Bitcoin now has a chance to resolve this debate through price movements. Breaking through $83,000 and then successfully stepping back will provide stronger confirmation. Another rejection could keep the 2026 range in place, forcing the market to wait longer for a clear answer.
Therefore, the next correction may reveal more about the new trend in Bitcoin than a strong rally that brought BTC back to near $80,000.
FAQs
Is Bitcoin out of the bear market?
Bitcoin is showing strong signs that its bear market may be over, although analysts say final technical confirmation remains to be seen.
How long does the BTC bear market last?
Historically, Bitcoin bear markets have typically lasted from peak to bottom for 10 to 14 months (an average of approximately 380 to 384 days).