Exchange Ranking
 Top Exchanges
 24h Volume Ranking
 Popularity Ranking
 Exchange BTC Balance
 Proof of Reserves
 Decentralized Exchanges
 Funding Rate
 Funding Heatmap
 Liquidation Data
 Max Pain
 Long/Short Ratio
 Whale L/S Ratio
 Binance/Okex/Huobi L/S
 Bitfinex Margin L/S
 ETF Tracker
 Solana ETF
 XRP ETF
 Hong Kong ETF
 Bitcoin Treasuries
 Crypto Reversal
 Ethereum Reserves
 HyperLiquid Wallet Analysis
 Hyperliquid Whale Watch
 Large Transactions
 On-chain Movement
 Bitcoin ROI
 Stablecoin Market Cap
 Options Analysis
 News
News Articles
 Economic Calendar
 Features
 Wallet
 Contract Calculator


 Security
 Collections
 Watchlist
 Following
 ETH
ETH Core Highlights
Major holders liquidate all Ethereum positions
Institutional demand and recovery of MVRV indicators point to strong momentum
Ethereum (ETH) fell back from US$2,546 to approximately US$2,438 against the backdrop of rising expectations of interest rate increases affecting the risky asset market.
Non-agricultural employment in the United States increased by 162,000 in August, far exceeding the expected 56,000, pushing the probability of the Federal Reserve raising interest rates to 60%.
Ethereum's market-to-realized value ratio (MVRV) fell below 1.00 on August 21, the first time in more than 200 days.
A major holder liquidated 167,855 ETH units worth approximately US$408 million in five days, exacerbating bearish pressure.
The Ethereum Spot ETF recorded a net inflow of US$148 million on Thursday, bringing the total inflow in August to US$1.85 billion.
Ethereum Price Trend Analysis
Earlier this week, Ethereum climbed to a peak of US$2,546 and then retreated to near the US$2,400 mark. The decline reflected market participants reassessing their exposure to unexpectedly strong employment data.
According to the non-farm payrolls report, the United States added 162,000 jobs in August, significantly exceeding the market consensus of 56,000 and a significant jump from the 21,000 in July. The unemployment rate remained unchanged at 4.1%, while the labor force participation rate climbed to 61.6%.
These strong jobs data increased the probability of the federal funds rate rising to the 3.75%-4.00% range to 60% from 49% the day before, according to the CME FedWatch tool. Typically, high interest rate expectations put pressure on speculative assets, including cryptocurrencies.
As of press time, ETH was trading at US$2,438. Despite the correction, the asset was trading above its 50-day, 100-day and 200-day index moving averages, which were clustered in the $2,069 to $2,175 range.
The Relative Strength Index (RSI) on the daily chart is 61, indicating positive momentum but not entering overbought territory. At the same time, MACD has turned negative, indicating that bullish momentum is weakening.
Major holders liquidate all Ethereum positions
A large Ethereum address liquidate all 167,855 ETH holdings-worth approximately US$408 million-in five days. According to Lookonchain intelligence, these assets were transferred to trading platforms such as OKX, Binance and Bybit.
At the time of analysis, approximately 70,739 ETH pieces had been delivered to the exchange, and the remaining 97,115 ETH pieces remained in the original wallet. This large-scale liquidation event is fueling the downward trend in prices.
In a related incident, a hacker linked to Coldcard attempted to convert stolen bitcoins into Ethereum through THORChain, processing about 10% of the damaged funds, while 90% remained dormant.
Recovery of institutional demand and MVRV indicators points to strong momentum
On a more positive note, the Ethereum Spot Exchange Traded Fund (ETF) recorded a net inflow of $148 million on Thursday. Cumulative inflows have reached US$13 billion, and total assets under management (AUM) are US$16 billion. <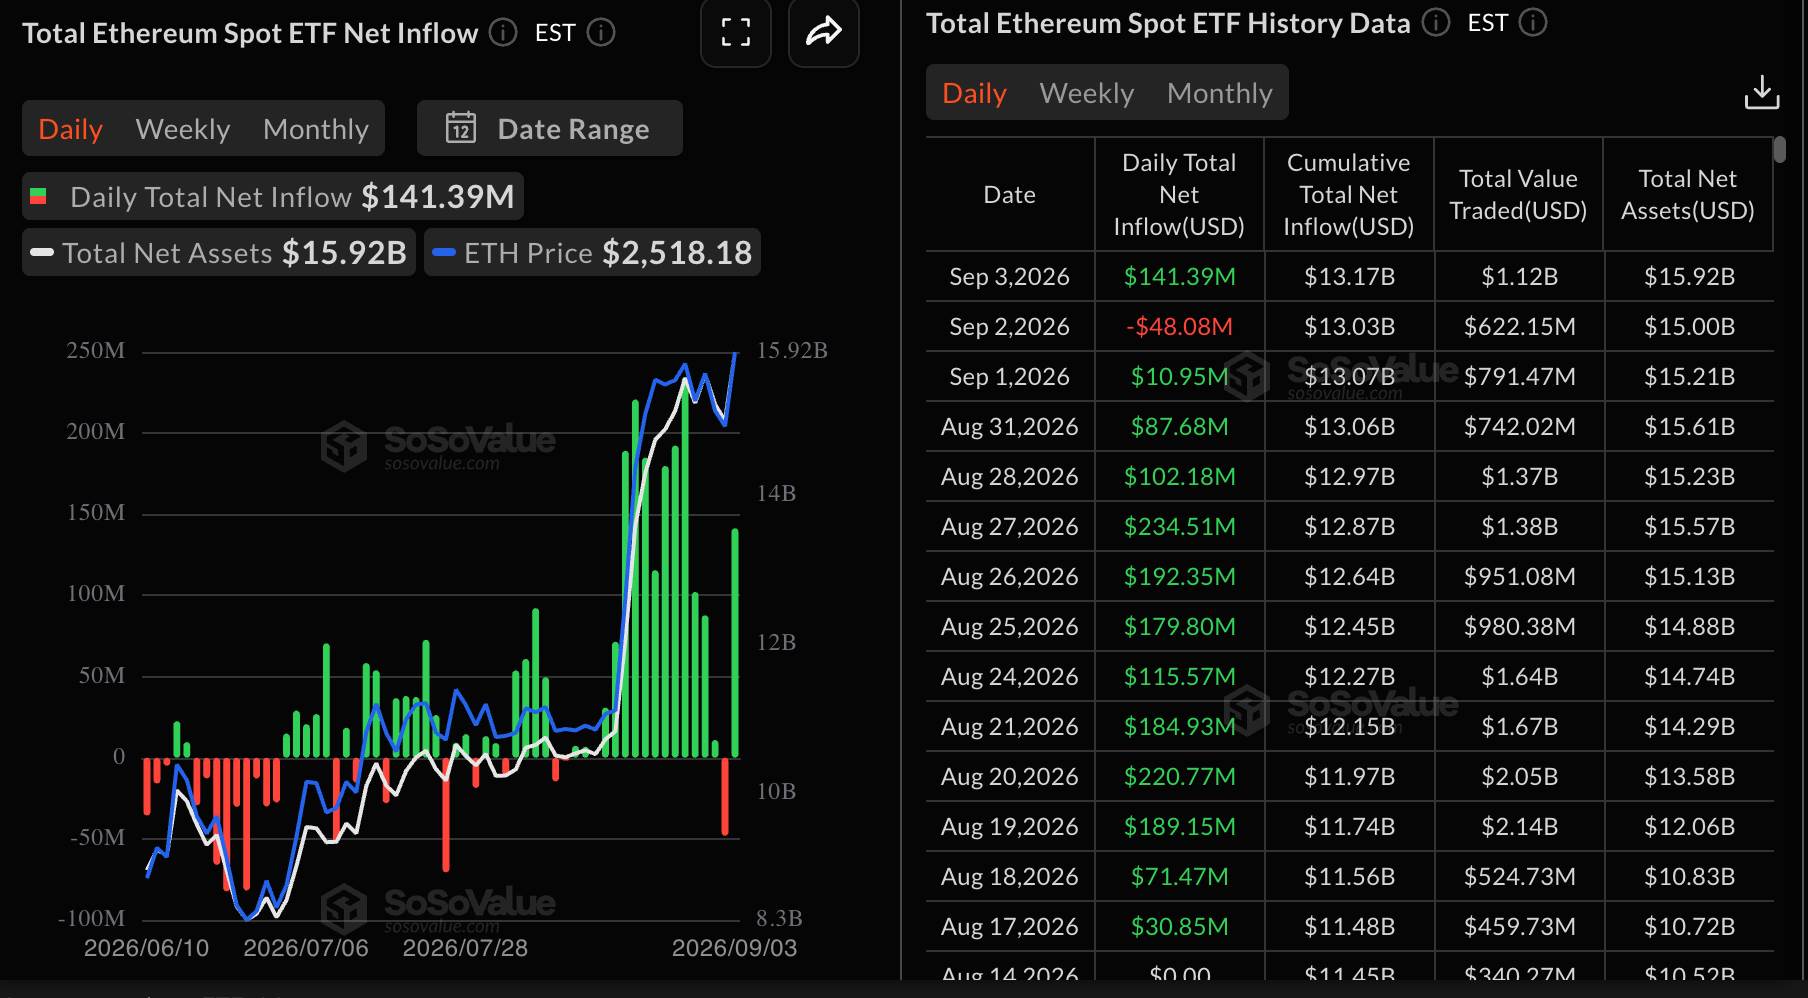 > Source: SoSoValue
Total ETF inflows in July were US$365 million, US$1.85 billion in August, and US$104 million recorded so far in September.
Ethereum's market capital-to-realized value ratio (MVRV) returned to 1.00 on August 21, the first time in 200 consecutive days. This indicator indicates that a typical ETH holder has returned to unrealized profitability, with a realized price of approximately US$2,300.
Technical analyst Aksel Kibar (CMT), operating account @TechCharts, observed that ETH/USD may form a bullish flag pattern at the resistance level and said: "ETH/USD may form a possible bullish flag pattern at the resistance level. I like this tight consolidation. Wait for confirmation of the breakthrough." Kibar's interpretation suggests that the current consolidation phase may signal an upward breakthrough, but the signal needs to be confirmed before verifying the pattern.
$ETHUSD Possible bull flag right at the resistance. I like this tight consolidation. Wait for breakout confirmation.
pic.twitter.com/w09VTGFHrv
- Aksel Kibar, CMT (@TechCharts)
September 5, 2026
Total ETH ETF inflows in September are currently US$104.26 million, and bulls continue to work hard to establish US$2,500 as a reliable support area.