Exchange Ranking
 Top Exchanges
 24h Volume Ranking
 Popularity Ranking
 Exchange BTC Balance
 Proof of Reserves
 Decentralized Exchanges
 Funding Rate
 Funding Heatmap
 Liquidation Data
 Max Pain
 Long/Short Ratio
 Whale L/S Ratio
 Binance/Okex/Huobi L/S
 Bitfinex Margin L/S
 ETF Tracker
 Solana ETF
 XRP ETF
 Hong Kong ETF
 Bitcoin Treasuries
 Crypto Reversal
 Ethereum Reserves
 HyperLiquid Wallet Analysis
 Hyperliquid Whale Watch
 Large Transactions
 On-chain Movement
 Bitcoin ROI
 Stablecoin Market Cap
 Options Analysis
 News
News Articles
 Economic Calendar
 Features
 Wallet
 Contract Calculator


 Security
 Collections
 Watchlist
 Following
 BTC
BTC Key insights
Bitcoin (BTC) prices are trading below May highs, and there is a major liquidity cluster in the region that could trigger short covering. Breaking through the May peak confirmed a bullish shift in Bitcoin prices and market structure. Bitcoin exchange-traded funds (ETFs) recorded daily net inflows of $730.87 million, sparking concerns that bitcoin prices could be near local highs.
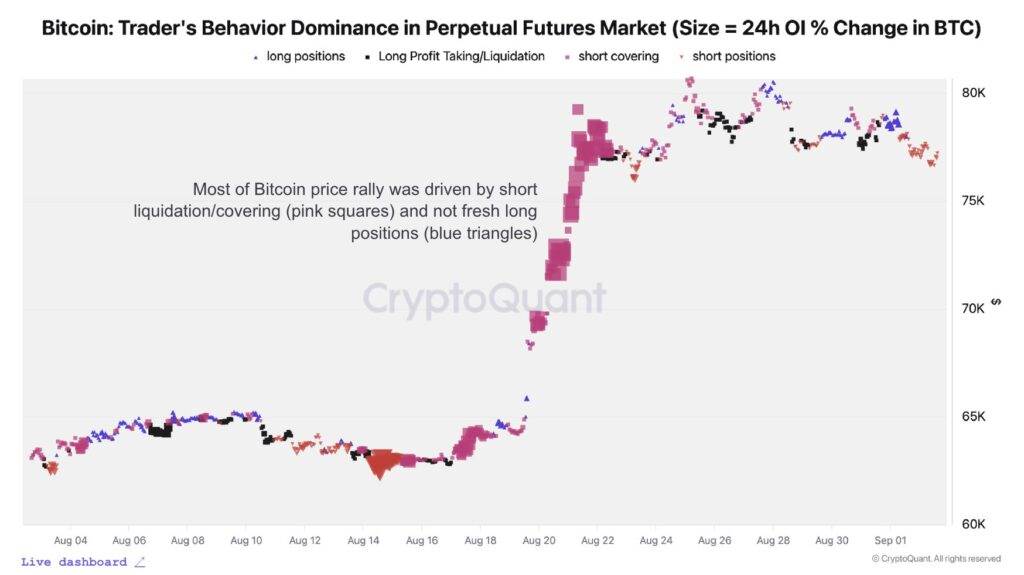
Bitcoin prices fell back to US$79,464 after failing to maintain their intraday trend above US$82,000. This reversal puts BTC prices below the main clearing cluster of US$82,000 - 83,000. At the same time, large ETF inflows triggered comparisons with previous local highs. According to CryptoQuant, the momentum for this rise mainly comes from short covering rather than demand from new buyers.
Bitcoin prices fell below the US$80,000 mark
Bitcoin prices started intraday gains around US$78,500, peaking at US$82,107. It then consolidated for several hours around $81,000, and selling pushed it below $80,000. As a result, the decline erased most of the intraday gains, although BTC still maintained a 1.2% growth over 24 hours.
Immediate support is near intraday lows of US$78,459. At the same time,$80,000 is the primary resistance to recovery in BTC prices. If there is a rebound, market attention will return to the resistance range between $81,500 and $82,100.
This resistance level is consistent with the clearing structure identified by Daan Crypto Trades. His heat map shows dense liquidity between $82,000 and $83,000, which is close to Bitcoin's May high. This "selling wall" came after Bitcoin recovered from its mid-August low.
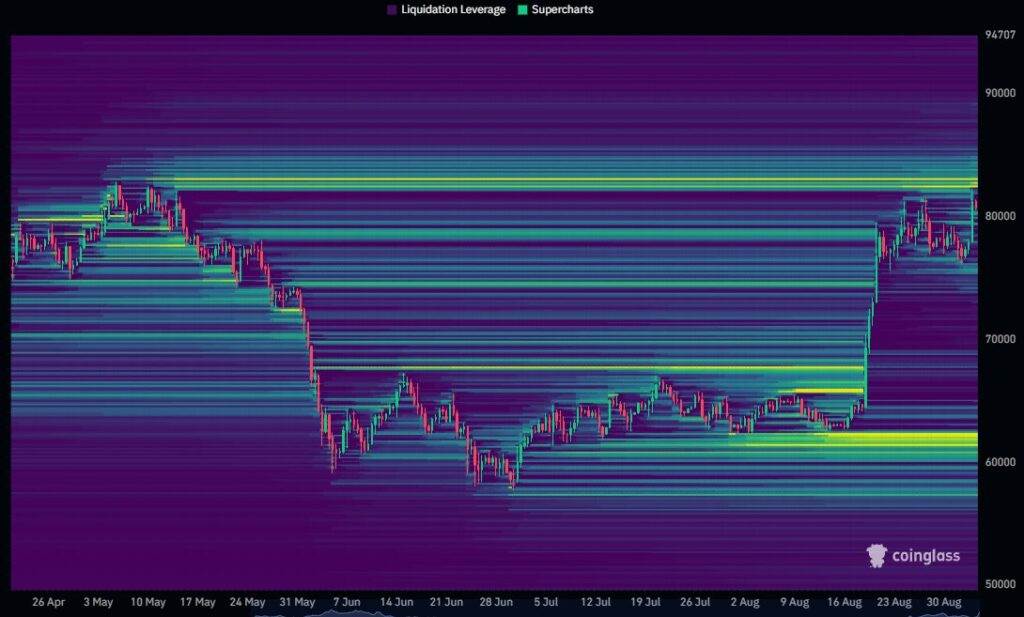
A decisive breakthrough may liquidate leveraged short positions and generate forced purchases. In addition, the move will allow Bitcoin to surpass its previous band highs. Daan pointed out that such a breakthrough would confirm a bullish shift in market structure.
However, another rejection could push Bitcoin prices towards lower liquidity levels. The heat map also shows a larger long clearing cluster around $61,000 - 63,000. Reaching this lower region requires a deeper market reversal.
Bitcoin ETF inflows reignite debate over local tops
Along with this selling wall, Ted analyzed the latest influx of $730.87 million in daily funds into Bitcoin ETF. His chart compares it to two previous trading sessions that totaled more than $700 million. Both incidents occurred near local highs before Bitcoin prices entered a deeper correction.
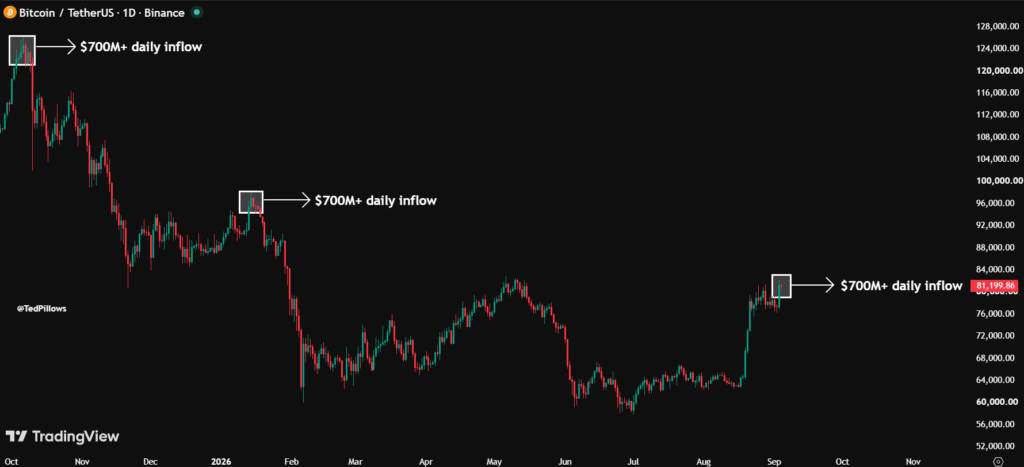
After those two surges in inflows, Bitcoin reversed from approximately US$124,000 and US$97,000 respectively. The latest total came when Bitcoin was traded around $81,200. Still, the first two examples do not establish a causal relationship between large ETF inflows leading to market reversals.
Ted's comparison needs to be confirmed before sending another short-term top signal. Specifically, the BTC price requirement encountered rejection around US$82,000 - 83,000, and then fell below US$78,000.
Jelle also reviewed the relationship between large inflows and market highs. He ranked $730 million in capital flows behind the $840 million inflow in January. This makes the latest figure the second largest daily inflow in 2026. Significantly, Jelle found previously comparable inflows occurring near local highs.
BTC weak demand constraints confirmed
CryptoQuant's data adds a perspective on buyer activity to resistance analysis and ETF analysis. After experiencing a 24% rebound, Bitcoin stabilized between $76,000 and $81,000. It reached $81,400 on August 28, before cooling into consolidation territory.
However, the rally stopped below the 365-day moving average of $82,300. CryptoQuant uses a closing price around $83,000 to confirm a new bull market. Previously, the company classified the movement as a rally during an early bullish period.
Basic demand has weakened. Obvious spot demand returned to contraction after briefly reaching its fastest expansion rate in 2026. In addition, the Coinbase premium turned negative at-0.05. CryptoQuant uses this indicator to measure the needs of U.S. investors.
Meanwhile, holders achieved a net profit of 23,000 BTC on August 21, the largest amount in a single day in 2026. Since August 19, net income achieved totals 110,000 BTC. CryptoQuant identified this activity as a bullish cooling signal after a rise.
Futures data showed that clearing and covering short positions drove most of the market. Few new long positions entered the market, and traders began to rebuild short positions. Even so, CryptoQuant's "bullish score" is still 70 points, which is in bullish territory. The company set support at around $69,000 near Bitcoin's 200-day moving average.