Exchange Ranking
 Top Exchanges
 24h Volume Ranking
 Popularity Ranking
 Exchange BTC Balance
 Proof of Reserves
 Decentralized Exchanges
 Funding Rate
 Funding Heatmap
 Liquidation Data
 Max Pain
 Long/Short Ratio
 Whale L/S Ratio
 Binance/Okex/Huobi L/S
 Bitfinex Margin L/S
 ETF Tracker
 Solana ETF
 XRP ETF
 Hong Kong ETF
 Bitcoin Treasuries
 Crypto Reversal
 Ethereum Reserves
 HyperLiquid Wallet Analysis
 Hyperliquid Whale Watch
 Large Transactions
 On-chain Movement
 Bitcoin ROI
 Stablecoin Market Cap
 Options Analysis
 News
News Articles
 Economic Calendar
 Features
 Wallet
 Contract Calculator


 Security
 Collections
 Watchlist
 Following
 SHIB
SHIB SHIB prices rebounded after weakening in early trading, and buying actively defended at key highs and regained upward momentum.
SHIB prices began to recover after early weakness. During the latest trading session, buying was actively defensive at higher prices and successfully resumed its upward momentum. The rebound was accompanied by an increase in trading volume, while support near $0.000052 remains at the core of the current price repair structure.
The chart shows that a potential bottom pattern is forming, but to ensure continued strength, the currently highlighted support areas must continue to be held. SHIB prices are recovering after a long downturn, and the latest charts show stronger demand, active trading activity, and a bottom structure formed near key support levels, with buying actively defending high levels.
Potential bottom-building structures emerge
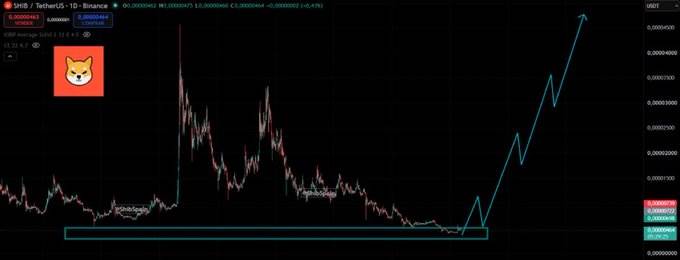
The latest trend structure shows a sharp rebound after a long price decline. Prices hit a long-standing area of support and then attempted a broader reversal. Therefore, the current focus is on the maintenance of support levels and the subsequent upward movement .
 Source: (Whales Care)
This structure is regarded by "Whales Care" as a potential underpinning area for SHIB. Relevant views are that the bottom has been established and a large-scale upward trend is brewing. The core of this view lies in accumulation near support levels rather than another isolated short-term rally.
The turquoise rectangles in the chart mark areas where buyers repeatedly defend prices. After successive lows and highs, prices finally reached this area. Holding this area is crucial to the bullish structure presented in the chart.
The forecast path shows a pattern of multiple upturns alternating with brief pullbacks. This model will create higher lows and highs while maintaining gradually increasing trading levels. The forecast points to continued expansion rather than a single vertical boom.
Recent transactions show buying activity is back in life
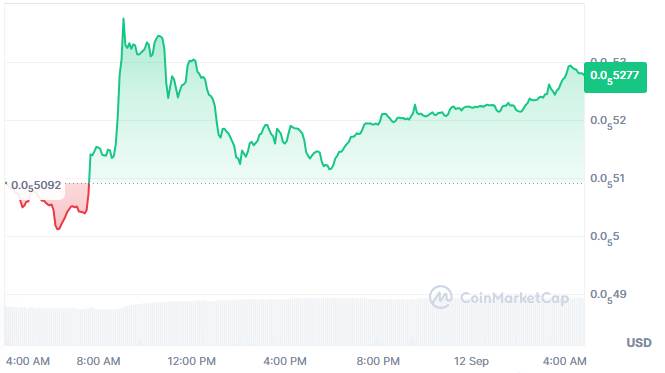
The latest chart shows that the SHIB price is around US$0.000005285, up 4.23% in 24 hours. Trading volume is currently close to $78.12 million, a daily increase of 25. 5 million. 64%。This volume-price coordination accompanied this rebound, indicating that market activity increased during the latest trading hours.
 Source: Coinmarketcap
Prices fell at the beginning of the trading session, hitting a range of approximately US$0.0000509. Buying then entered aggressively, pushing prices up sharply in the morning session. This pull-up caused the price to exceed US$0.000052 and then entered the correction stage.
After the initial surge, prices fell back and formed multiple intraday bands. However, the decline did not fully retreat back to the beginning of the session. Instead, prices stabilized and gradually recovered in the afternoon and evening.
Subsequent chart action shows that a series of higher prices gradually formed during this period. The price eventually moved again towards the upper boundary near $0.00005285. The recovery has turned the market's focus to whether buying can maintain these high trading levels.
US$0.000052 remains a key reference point
US$0.0000052 region has become an important reference level in the recent recovery. Prices broke through that level after the early surge and subsequently consolidated around the region. If we can continue to stand firm, we will retain the stronger structure visible later in the period.
Early historical charts provide a broader context for the current support structure. Previous rallies have been accompanied by deep retracements and long-term downward movements . As a result, the current bottom structure lies under a longer revised price structure.
Market data also showed that the market value was approximately US$3.11 billion. The circulation supply is approximately 589.23 trillion coins, and the number of positions exceeds 3.08 million coins. According to the data displayed, the ratio of volume to market value is currently approximately 2.5%.
The bullish forecast on the chart relies on continued support and upward momentum. If prices break through recent highs, it will further extend the sequence of higher trading levels. If prices fall back below the support area, it will weaken the structure shown in the analysis.