Exchange Ranking
 Top Exchanges
 24h Volume Ranking
 Popularity Ranking
 Exchange BTC Balance
 Proof of Reserves
 Decentralized Exchanges
 Funding Rate
 Funding Heatmap
 Liquidation Data
 Max Pain
 Long/Short Ratio
 Whale L/S Ratio
 Binance/Okex/Huobi L/S
 Bitfinex Margin L/S
 ETF Tracker
 Solana ETF
 XRP ETF
 Hong Kong ETF
 Bitcoin Treasuries
 Crypto Reversal
 Ethereum Reserves
 HyperLiquid Wallet Analysis
 Hyperliquid Whale Watch
 Large Transactions
 On-chain Movement
 Bitcoin ROI
 Stablecoin Market Cap
 Options Analysis
 News
News Articles
 Economic Calendar
 Features
 Wallet
 Contract Calculator


 Security
 Collections
 Watchlist
 Following
 SOL
SOL The giant whale returned after two years and once again increased its holdings in Solana
A giant whale that had been accurately positioned before the Solana market rebounded significantly, resumed its holdings after two years of silence. The market is currently in a consolidation stage, with the $75 support level and the $78 resistance level becoming the focus, and the price has fallen from previous highs, making the technical side still fragile. The re-purchase of the giant whale has injected new interest into the market, but only by continuing to stand above the resistance level can the recovery momentum be expected to expand further.
Solana is at a technical crossroads: the re-shareholding of the giant whale coexist with a long-term correction and narrow trading range. Buyers face resistance, and support levels are also receiving much attention.
The giant whale returns after two years.
According to Lookonchain, the smart money giant whale named GvHYQQ has returned to life after two years. The wallet purchased another 47,535 SOL units worth approximately US$3.6 million. Before the transaction occurred, the address had no record of activity for a long time.
https://twitter.com/lookonchain/status/2089539581159068002? s=20
This wallet once held a total of 291,790 SOLs in August and October 2023. These purchases cost approximately $6.82 million, with an average price of $23.37. The buying occurred before the token entered a multi-year recovery cycle.
According to Lookonchain's trading records, GvHYQQ later sold 191,789 SOL units for approximately US$24.62 million, with an average selling price of US$128.36. These sell-offs achieved realized profits of more than $20 million.
As a result, the latest purchase has renewed market attention to the timing of this giant whale. Its early additions occurred during periods of significant market weakness, while new purchases came after prices fell sharply from previous cyclical highs.
Price structure shows narrow recovery
Chart shows SOL's current price is $75.91, and buyers are defending the $75 zone. Recent trends suggest prices have rebounded from a low of around $71.20 in early August. However, the rebound has not yet broken through the $77 resistance zone.
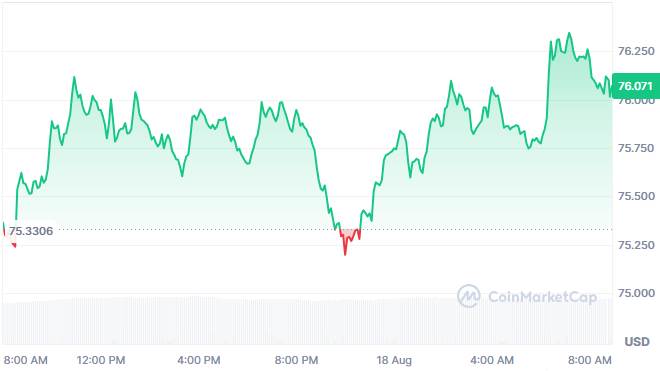
The short-term structure is still limited between support and over-selling pressure. Prices approached resistance several times before falling back to lower levels. This model suggests that buyers have not yet established decisive control.
The US$75 area remains the main short-term defense line. Holding this level will maintain the recent recovery structure on the chart. If support continues to fall below, the August low may be retested.
https://coinfutura.com/wp-content/uploads/2026/04/EliteFXLabsBanner-1.webp
On the upside, US$78 is the clearest confirmation level for buyers. If this resistance is decisively exceeded, it will improve the short-term technical structure and may turn attention to higher resistance levels after a long-term correction.
Giant whale activity meets broader market correction
A broader chart shows prices have fallen sharply from highs of around $250-$260. There were several attempts to rebound during the decline, but eventually lost momentum. As a result, the market is still well below its previous cycle high.
The best growth stage occurs after the giant whale increase period. Prices gradually rose throughout 2024 and early 2025, and this rally eventually pushed assets above $200.
The current consolidation is completely different from the previous expansion phase. Prices show narrower fluctuations after a long decline. Trading activity must increase before the next sustained and directional trend can emerge.
The new purchase of giant whales has added new chain interest to this technical landscape. However, the deal alone cannot establish another major market reversal. Price confirmation still depends on whether buyers can recover key resistance levels.
Currently, the market is maintaining a balance between overweight signals and technical weakness. The history of the giant whale provides the background, while the chart defines the boundaries of immediate transactions. A break above $78 or a break below $75 would provide clearer evidence of direction.