
 Exchange Ranking
 Top Exchanges
 24h Volume Ranking
 Popularity Ranking
 Exchange BTC Balance
 Proof of Reserves
 Decentralized Exchanges
 Funding Rate
 Funding Heatmap
 Liquidation Data
 Max Pain
 Long/Short Ratio
 Whale L/S Ratio
 Binance/Okex/Huobi L/S
 Bitfinex Margin L/S
 ETF Tracker
 Solana ETF
 XRP ETF
 Hong Kong ETF
 Bitcoin Treasuries
 Crypto Reversal
 Ethereum Reserves
 HyperLiquid Wallet Analysis
 Hyperliquid Whale Watch
 Large Transactions
 On-chain Movement
 Bitcoin ROI
 Stablecoin Market Cap
 Options Analysis
 News
News Articles
 Economic Calendar
 Features
 Wallet
 Contract Calculator


 Security
 Collections
 Watchlist
 Following
 BONK
BONK Bonk has been out of market discussions for a long time after experiencing the explosive market from 2023 to 2024. The current chart trend is beginning to imply some signs worthy of renewed attention. This 2030 Bonk price forecast is not based on subjective expectations, but is based on the true pattern presented by the lunar candle chart.
BONK is currently trading at around US$0.0000407, just above a tight support range after a long period of sharp decline from previous highs. This decline has been following a clear downtrend line that prices are currently closely following-which is why this 2030 Bonk price forecast is worth delving into at this time.
There is no indication that prices will rise in a straight line, but there is indeed a real structure that is taking shape and worth sorting through layer by layer.
Why $BONK deserves attention again?
$BONK has been losing in a fairly orderly manner in the second half of the recent decline. The high point of each rebound is suppressed by the same downtrend line extending from the previous high point on the chart.
This pattern usually attracts attention when prices eventually start to compress near the trend line rather than slipping straight through. Either $BONK finds support here and starts building a true bottom, or it breaks again, continuing the downward trend defined on the chart for most of the time.
A quick review of BONK's chart trends
Early in the chart, BONK closed out a series of strong positive lines during the initial pull-up period, followed by a long and heavy negative line, driving prices down to current levels-a pattern quite typical for meme coins in the second half of the "boom-bust" cycle.
What's important now is that the pace of decline has slowed. Prices no longer accelerate their decline, but compress into a narrower range above support, just close to the downtrend line that has suppressed all recent attempts at rebound.
Is BONK actually supported, or is it just a chart form?
BONK has many things that pure memecoin does not have: an active ecosystem that includes BonkSwap, BonkDEX and related Solana ecosystem tools; a series of community-driven destruction events that have effectively reduced supply; and deep integration with hundreds of Solana dApps.
This gives it a higher demand base than those with only one mascot. Whether this ecosystem will be enough to drive a serious and long-term recovery is another question. But this is one reason why BONK remains relevant for longer than many tokens launched during the same period.
Monthly chart analysis of 50 times Bonk price forecast in 2030
The most prominent feature of this chart is the downtrend line that extends from previous highs and runs through recent price movements, which suppresses every rebound along the way.
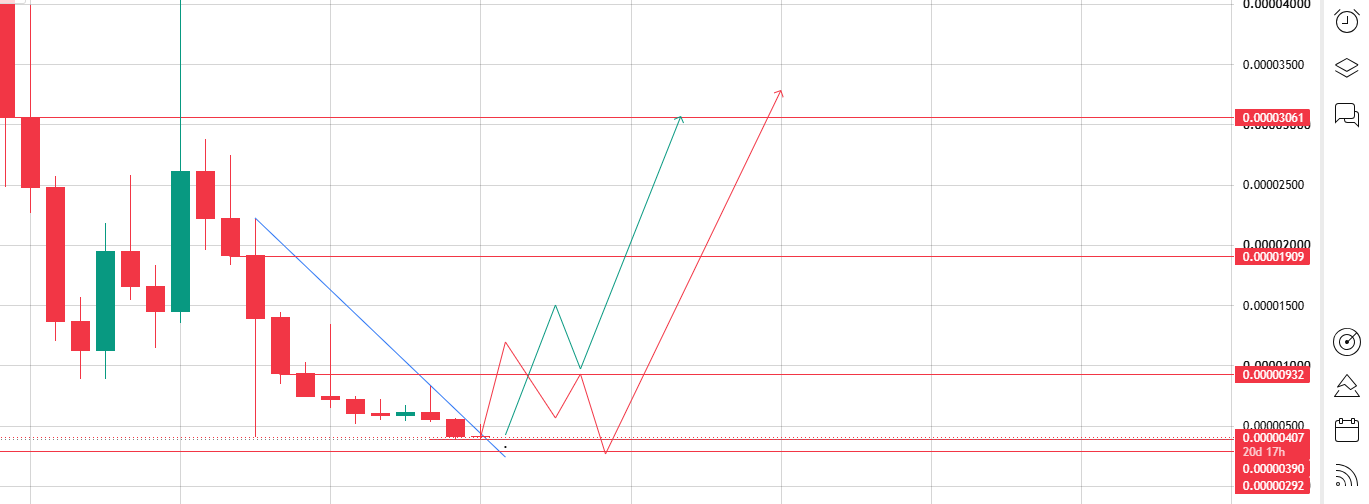
BONK is currently trading at US$0.0000407; the following is the distribution of key levels.
Upper resistance level:
US$0.0000932-the first real ceiling and the level that needs to be exceeded to show the true end of the downtrend.
US$0.00001909-The next level is about 4.7 times the current price.
US$0.0003061-The level that confirms a true trend reversal (rather than just a rebound from support).
Lower support level:
US$0.0000390-the defensive level in the current support range.
US$0.0000292-A deeper bottom, the price that the entire structure needs to hold if this correction extends further.
Long-term outlook for 2030
stretches out, and the path of $BONK to 2030 depends largely on the following factors: whether the downtrend line is actually breached; whether the Solana ecosystem continues to grow (which usually drives BONK to rise); and whether continued destruction activities can substantially reduce the maximum supply of the token of approximately 88.87 trillion yuan in the long term.
This combination-chart structure, network-level downwind factors, and proactive deflation mechanisms-gives BONK a more complex support base than most meme coins.
2030 Bonk Price Forecast Scenario
Scenario| 2030 target price| Catalyst required
Bear market scenario: US$0.000015-The trend line broke through failed and could not be reversed, the support level fell, and liquidity continued to shift to the newer Solana meme coin.
Baseline scenario: US$0.00001909-After multiple cycles of steady climbing, it finally breaks through the trend line and converts it into support.
Bull Market Scenario: US$0.0003061-Strong Solana ecosystem cycle, coupled with aggressive destruction activities and new memecoin mania.
Reaching the high end of this range does not depend on a single pull-up, but takes years to keep the ecosystem active and continue to reduce supply through destruction.
Bonk Annual Target Table (2026 - 2030)
Year| Bear market scenario| baseline scenario| Bull Market Scenario
2026| $0.0000292| $0.0000407| US$0.00000932
2027| $0.000025| $0.000065| US$0.0000115
2028| $0.000020| $0.000098| US$0.0000155
2029| $0.000018| $0.000145| US$0.000225
2030| $0.000015| $0.00001909| US$0.0003061
Three scenarios worth noting
Worst scenario: The downtrend line continues to serve as resistance, the US$0.0000390 support level is eventually broken,$BONK slips towards US$0.0000292 or even lower, and market attention shifts to the new Solana eco-meme coin.
Benchmark scenario: $BONK slowly bottoms out along the trend line, gradually clearing resistance levels over multiple cycles, and steadily climbing to US$0.00001909 in 2030, without a sharp breakthrough during this period.
Best scenario: The Solana ecosystem enters a period of strong multi-cycle growth, destruction activities accelerate, and $BONK decisively breaks through all three resistance levels and moves towards $0.00003061 or higher.
Overview of key levels
Resistance zone: US$0.0000932 to US$0.00003061-these are the three ceilings between now and the true trend reversal.
Support area: US$0.0000292 to US$0.0000390-the foundation that currently supports the entire structure.
Expiration conditions: Monthly closing prices are clearly below $0.0000292, which will completely undermine the current bottom and stall any recovery scenario for the foreseeable future.
Final thoughts on BONK to 2030
The current pattern is more interesting than most movements in $BONK's recent chart history, mainly because prices have stopped accelerating downward and are compressing against a trend line that has been stable for some time.
This is not any guarantee, but it is a clearer technical foundation that BONK has developed over time. If you want to turn the trend into more than just a short-term rebound, any real push towards US$0.0000932 will require volume and capacity.
Beyond the chart, BONK's long-term story will continue to rely on the growth of Solana's entire ecosystem and whether continued destruction mechanisms can effectively offset its huge supply of tokens. Five years is a long track, and where BONK ends up in 2030 will likely depend on whether the combination is solid and is as important as anything you can see on today's charts.






















