Exchange Ranking
 Top Exchanges
 24h Volume Ranking
 Popularity Ranking
 Exchange BTC Balance
 Proof of Reserves
 Decentralized Exchanges
 Funding Rate
 Funding Heatmap
 Liquidation Data
 Max Pain
 Long/Short Ratio
 Whale L/S Ratio
 Binance/Okex/Huobi L/S
 Bitfinex Margin L/S
 ETF Tracker
 Solana ETF
 XRP ETF
 Hong Kong ETF
 Bitcoin Treasuries
 Crypto Reversal
 Ethereum Reserves
 HyperLiquid Wallet Analysis
 Hyperliquid Whale Watch
 Large Transactions
 On-chain Movement
 Bitcoin ROI
 Stablecoin Market Cap
 Options Analysis
 News
News Articles
 Economic Calendar
 Features
 Wallet
 Contract Calculator


 Security
 Collections
 Watchlist
 Following
 ADA
ADA Cardano prices are close to US$0.20, and bulls test resistance
ADA rose nearly 19% during the week and is testing resistance around US$0.20. 0.196 The range to $0.214 will determine the next step. The RSI is close to 70, indicating that the overbought rebound has hit the upper supply zone. Short squeeze and futures buying have combined to drive the rally since June lows. Cardano traded just above $0.20 on Friday and gained nearly 19% for the week, keeping the ADA away from its June low of $0.138. The coin's market value once again reached approximately $7.33 billion and has rebounded to the lower half of a price range that suppressed all gains during June and July. The daily chart has reached a critical point: the rebound will either prove its effectiveness or stall.
Upward channel that rallies from a low of US$0.138
This round of rally is built within a clear upward channel that starts from the June low. The lower track provided support at both lows and during the July correction, giving the structure a bottom on which traders can actually rely, and prices have now hit the upper track. This upper track happens to be in the first important resistance zone left by the spring plunge. Fibonacci retracement measurements from a May high of $0.289 to a June low of $0.138 show the 0.382 line at $0.1958 and the 50% retracement level at $0.2136. ADA is sandwiched between these two lines. These lines are important because buyers trapped on the way down tend to sell when prices rise, which is why rallies often hesitate here.
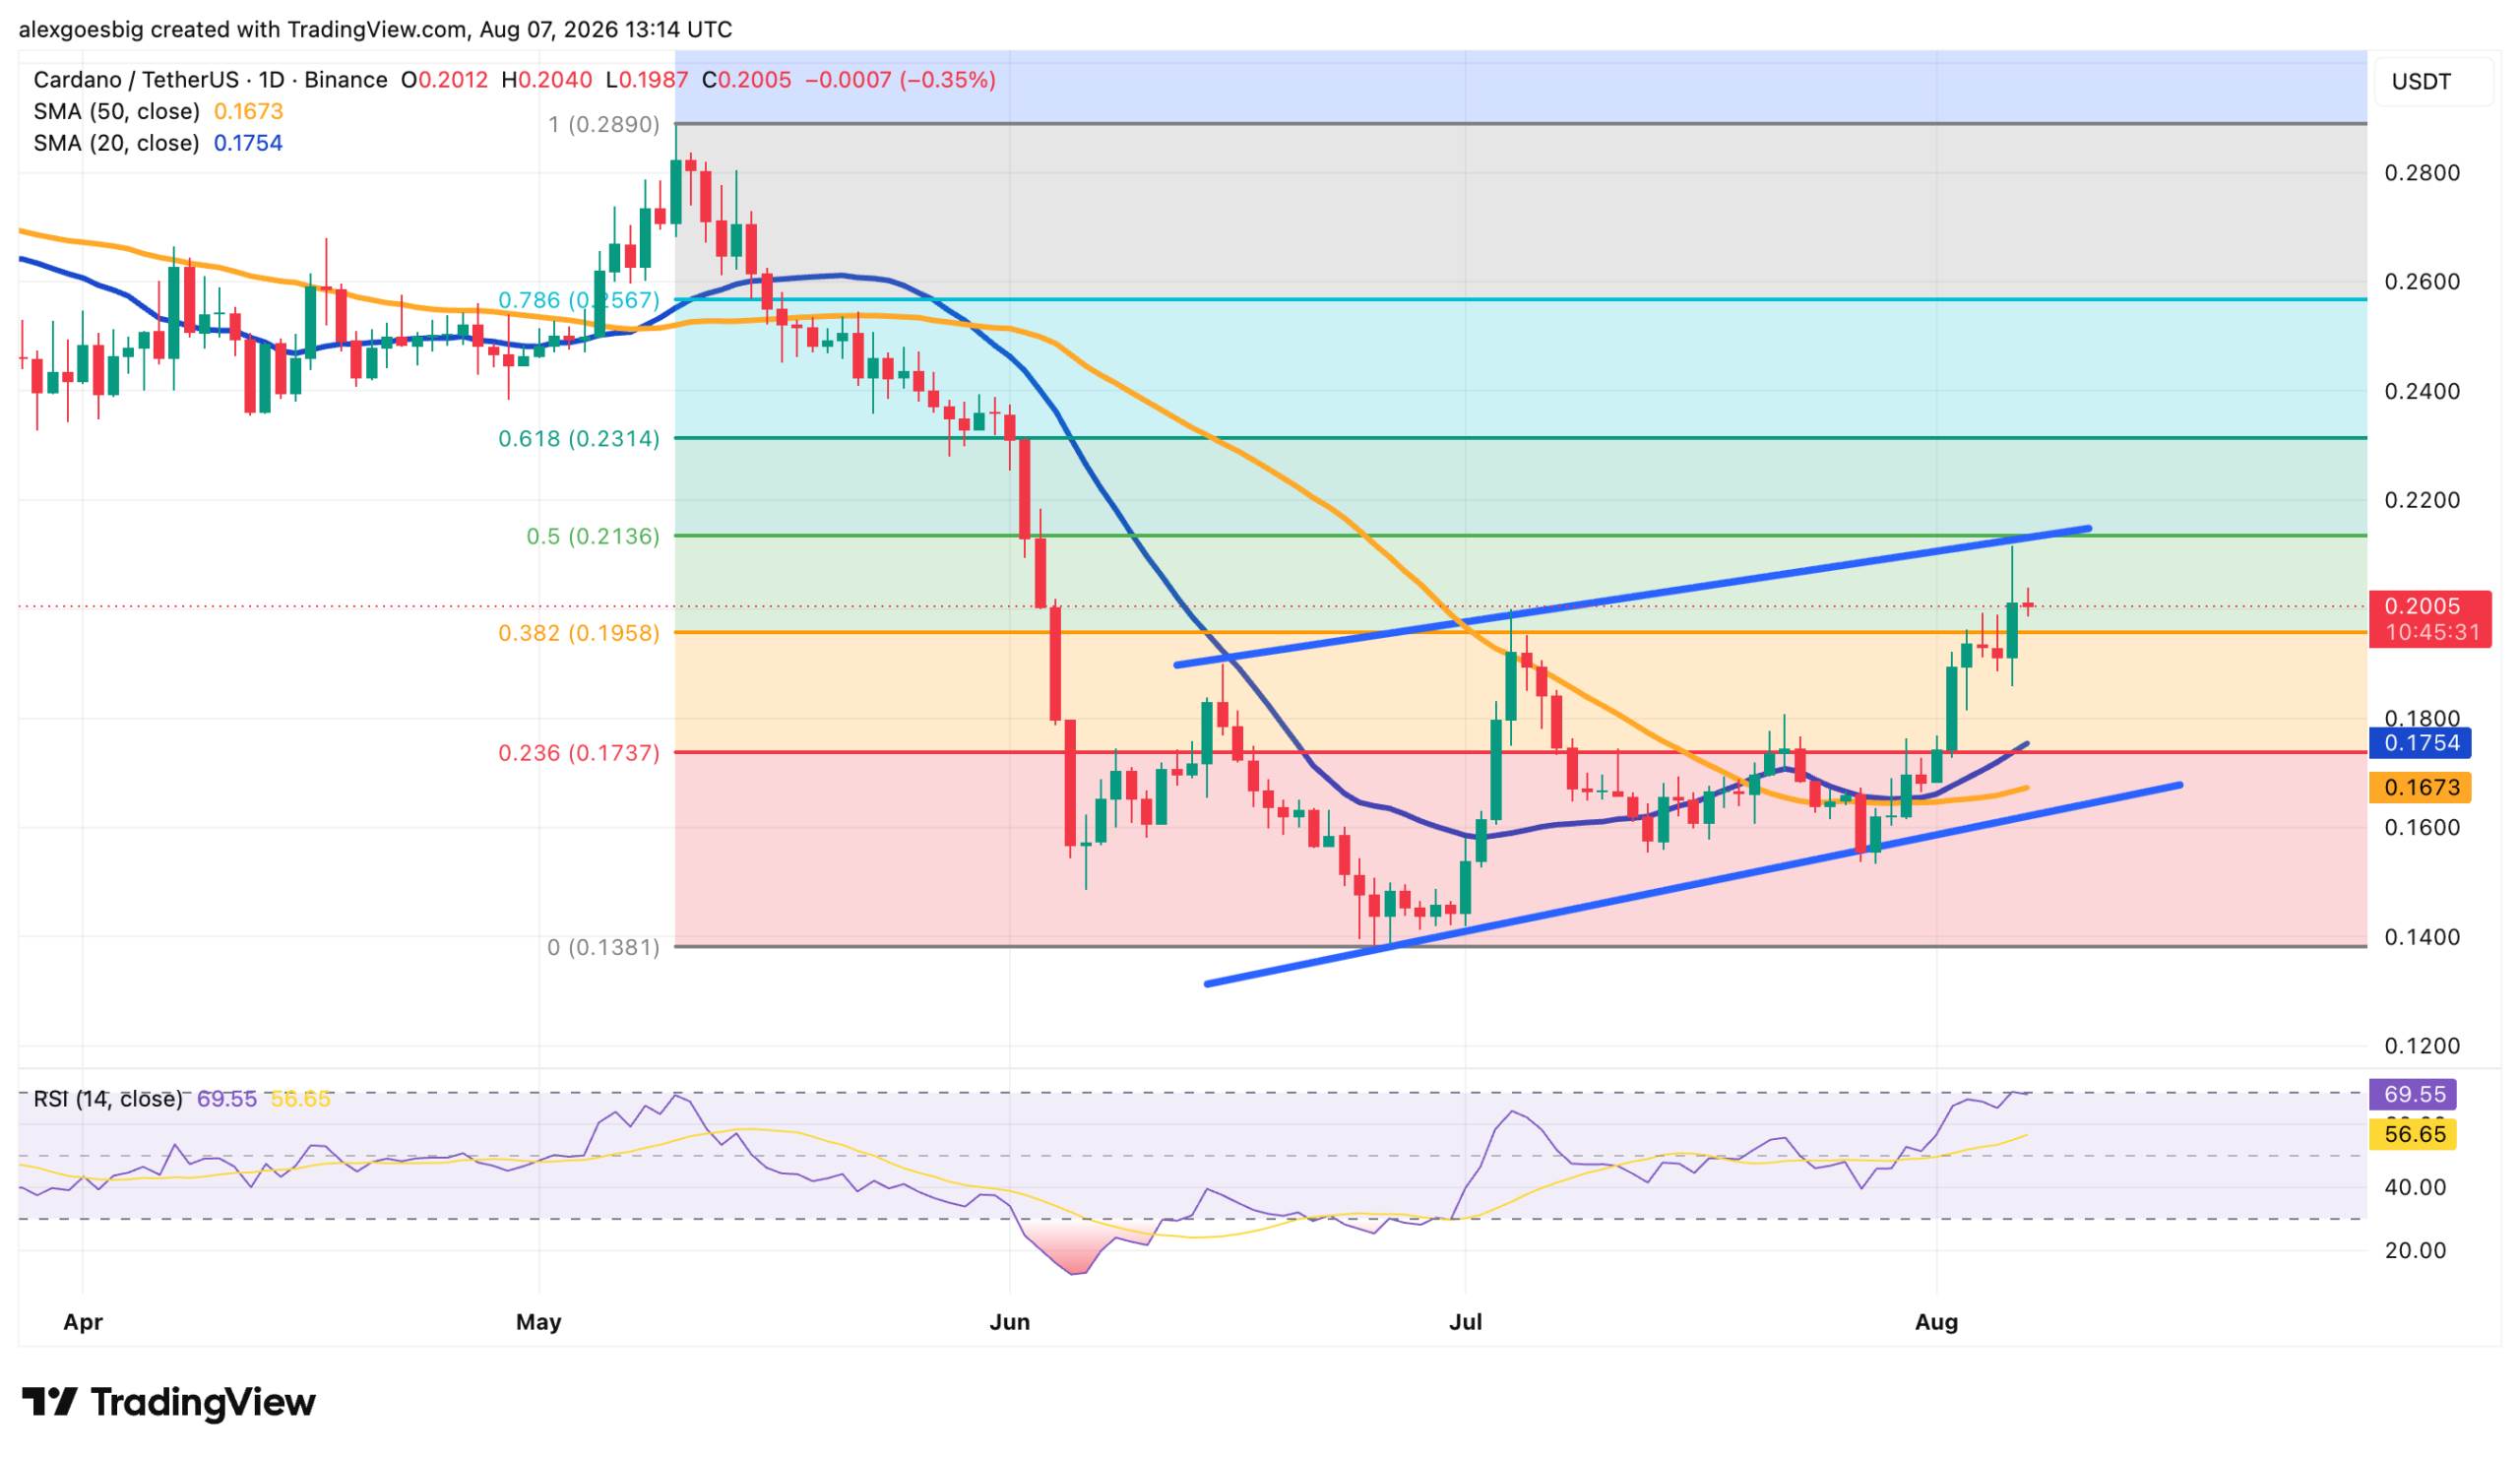 ADA/USDT daily chart. Chart provided by Alexander Stefanov.
Kinetic energy has strengthened but stretched at its worst positions
ADA has regained its 20-day and 50-day moving averages, and the faster 20-day moving average has crossed the slower 50-day moving average. This crossover, where the short-term moving average rises above the long-term moving average, usually signals a real shift in short-term trends rather than just a strong trading day. The problem is RSI. The RSI on the 14th has climbed to around 70, the level at which buying speeds usually reach their limit and are about to pause, and it occurs just as prices hit channel resistance and the 50% Fibonacci retracement level. Overbought itself does not force a top. But overbought combined with supply pressure above is why rallies often stall before the market chooses direction.
What really pushed the ADA away from its June lows
Prices did not reverse on their own. Much of the early moves came from traders who went in the wrong direction. As of the end of July, positions had been heavily biased towards short positions, so the breakthrough triggered a short squeeze. According to CoinGlass data, as of August 7, the 24-hour trading volume of ADA futures was approximately US$1.03 billion, and the open interest was nearly US$519 million. Short liquidations exceeded long positions, and leveraged short positions were forced to cover their positions. Such forced buying tends to be self-reinforcing and explains the speed of the rally better than any single headline.
At the transaction level, Cardano's development schedule provides buyers with reasons to stay on the floor. The van Rossem hard fork on July 18 upgraded the network to protocol version 11, enhancing Plutus performance and node security, and the Intersect sees it as a runway towards the Dijkstra phase and its Leios expansion work. Chainspect also recorded a record 16 for Cardano's Nakamoto Satoshi coefficient, a measure of the degree of decentralization of a network.
Key levels to determine the next move
The roadmap thereafter is not complex. The daily close is clearly above US$0.214, and the RSI remains firm rather than turning, will break through the top of the channel and open the way to the 0.618 Fibonacci retracement level of US$0.2314 and the heavier US$0.256 mark. If the current price is rejected, it will fall back to the 0.382 line of US$0.1958. A break below this line will look towards the lower track of the channel and the rising 50-day moving average, which is in the US$0.167 to US$0.174 range. This downward trajectory is the line of defense on which the entire rebound relies.
Breakout scenario: closed above US$0.214, and the RSI remained firm with a target of US$0.2314, then the US$0.256 mark.
Rejection scenario: stagnates in the range of US$0.196 to US$0.214, retracts to US$0.1958, and then moves downward.
Break scenario: Loses its lower track and 50-day moving average, targets US$0.167 to US$0.174, and June lows are back in view.
Why August 9 and October appear on every ADA trader's calendar
The two dates provide a background for the current trend that the chart itself cannot show. Cardano's CME futures will complete their six-month maturity window on August 9, a technical condition that could have an impact on U.S. spot ETF applications because exchanges currently rely on common listing standards. This does not guarantee anything. Gray plans to launch spot ADA products in October, and there is currently no U.S. spot ADA ETF trading, so any approval will be a new demand rather than an expectation that the market has already absorbed.
The macro environment is not so favorable. Bitcoin's dominance rate remains above 56%, which usually means that funds have not been significantly rotated into altcoins, while the Market Fear and Greed Index reads 27, which is in the deep fear area. A token trying to break through resistance in a defensive market is under much greater pressure than under broad risk appetite.
The hidden gap in rebound
One data brings enthusiasm back to reality. According to DefiLlama data, Cardano's total locked position value in DeFi is approximately US$70.87 million, and the market value exceeds US$7.3 billion, so ADA's price has little to do with chain usage. The rally also relied more on leverage than belief: CoinGlass showed that despite the surge in futures activity, options trading volume plunged nearly 93%, meaning the rebound was driven by short-term positions that can be closed as quickly as they were established. This is the real test after $0.214, which coincides with the expiration of the CME milestone on August 9.