Exchange Ranking
 Top Exchanges
 24h Volume Ranking
 Popularity Ranking
 Exchange BTC Balance
 Proof of Reserves
 Decentralized Exchanges
 Funding Rate
 Funding Heatmap
 Liquidation Data
 Max Pain
 Long/Short Ratio
 Whale L/S Ratio
 Binance/Okex/Huobi L/S
 Bitfinex Margin L/S
 ETF Tracker
 Solana ETF
 XRP ETF
 Hong Kong ETF
 Bitcoin Treasuries
 Crypto Reversal
 Ethereum Reserves
 HyperLiquid Wallet Analysis
 Hyperliquid Whale Watch
 Large Transactions
 On-chain Movement
 Bitcoin ROI
 Stablecoin Market Cap
 Options Analysis
 News
News Articles
 Economic Calendar
 Features
 Wallet
 Contract Calculator


 Security
 Collections
 Watchlist
 Following
Pi Network Price Forecast: Market Outlook on the Eve of Protocol 27 Upgrade
This article analyzes the current situation of Pi Network ahead of one of its most anticipated protocol upgrades. Pi Network was launched as a mobile mining project in 2019 and subsequently transformed into an Open Network. Currently, PI tokens have become fully transferable.
As of now, the price of Pi Network is $0.09786, up 3.6% in the past 24 hours. The trading range is between $0.09446 and $0.09958, and the market value is $1.09B.
Pi Network Real-time Market Data
Indicator Value $0.09786 Market Value $1.09B Fully Diluted Valuation (FDV)$1.677B 24 Hours Trading Volume $7.711M Circulation Supply 11.142B Total Supply 17.141B Maximum Supply 100B Data source: Pi Network market data is obtained from CoinGecko, as of September 9, 2026. Data from other tracking sites may differ slightly.
Today's Pi Network News: Protocol 27 countdown
The community is hotly discussing the future significance of Protocol 27
According to Pi Network News Alerts, Protocol 27 is the last major upgrade planned and will bring improved smart contract authentication capabilities, Decentralized exchange (DEX) and automated market maker (AMM) infrastructure, deeper liquidity and true on-chain utility.
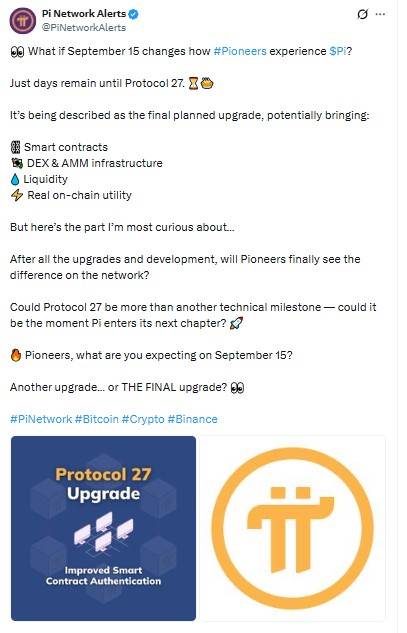
The post raised an open question in the community: Will the upgrade ultimately make a visible difference on the web, or will it just add to a series of previous updates? This uncertainty is worth considering in conjunction with the price level below, as the market's response is likely to depend on what is actually launched on September 15, rather than on the announcement itself.
Breakthrough pattern before the upgrade
CoinGape reported that PI prices remain above $0.095, and market sentiment is brewing as Protocol 27, which is expected to be launched on September 15, brings smart contracts, DEX, AMM and liquidity functions to the Internet.
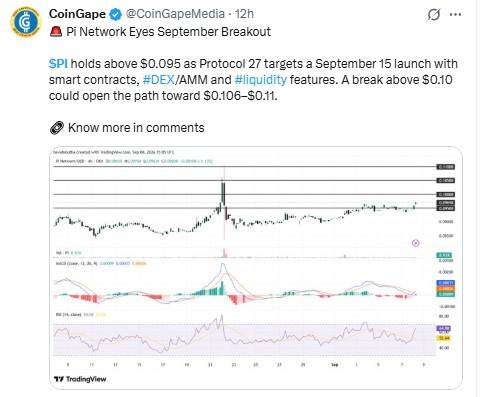 Photo source: Data Taken From @CoinGapeMedia, X Account, as of Sep 9, 2026
The media pointed out that if the price exceeds $0.10, it will open the door to the range of $0.106 to $0.11, and the chart shape is directly linked to the upgrade timeline.
Pi Network 2026 Price Forecast: Technology Outlook
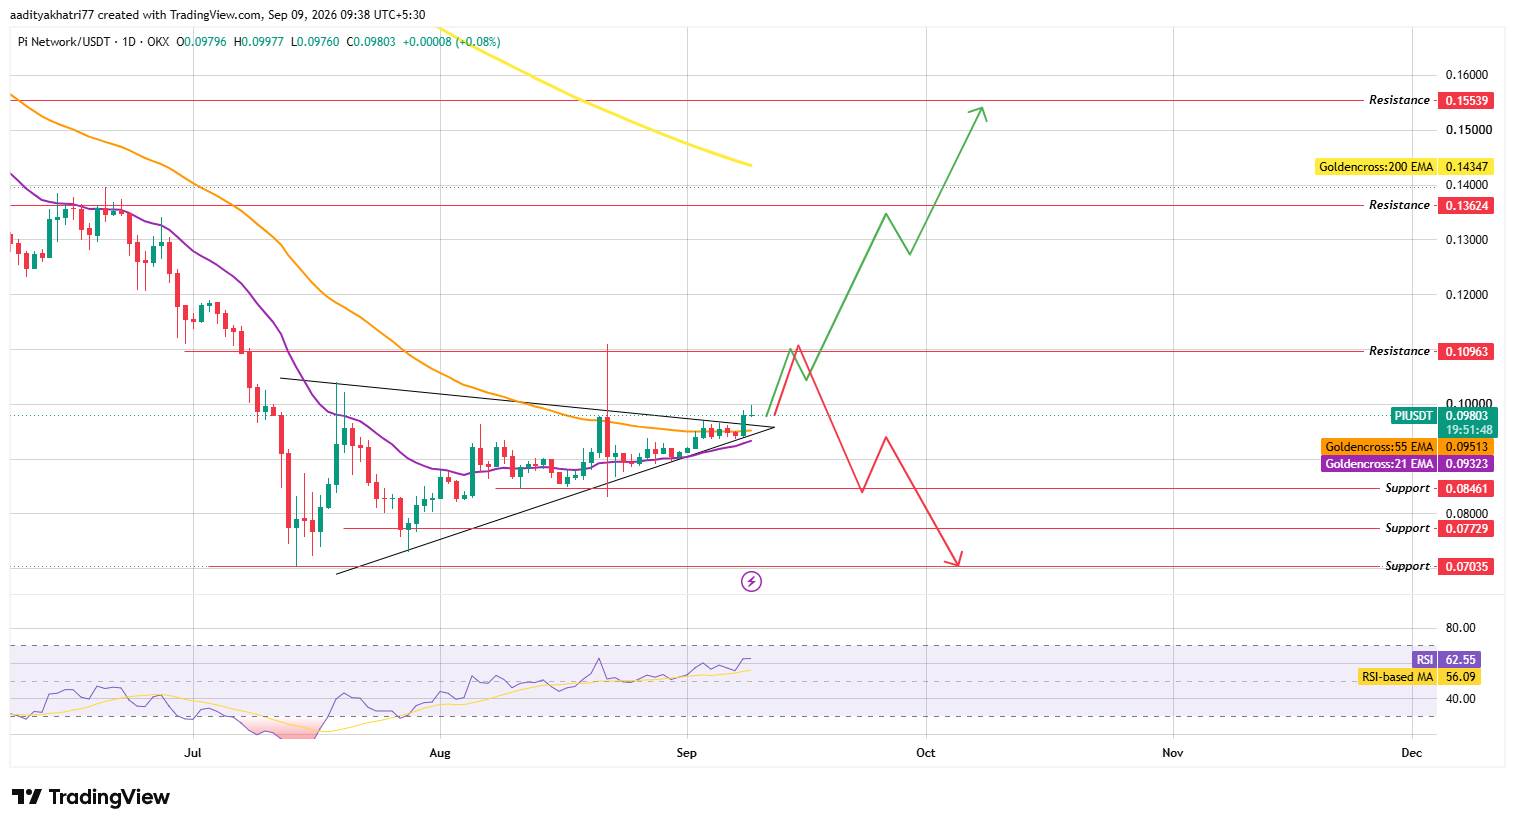
On OKX's daily PI/USDT chart, since July, prices have been consolidating within an asymmetric triangle, with its upper border falling and its lower border rising.
Currently,$PI is approaching this upper boundary and prices are trading above the 21st and 55-day exponential moving averages (EMA), indicating that short-term momentum has turned supportive. The Relative Strength Index (RSI) was at 62.55, above its moving average of 56.09, reflecting that bullish momentum is building but has not yet overstretched.
Can PI break through to higher resistance levels?
If the PI closes a daily candle chart in a volume amplification manner and breaks through the upper boundary of the triangle, the first target will be $0.10963. If it continues to strengthen at this position, it will open the door to $0.13624; if momentum continues into the rest of the month, the next resistance level will be $0.15539.
What happens if the PI encounters rejection at resistance?
If the price is rejected and slides at the triangular resistance level, the first support level to watch is $0.08461. If this level cannot be held, PI may fall to $0.07729; if weakness persists,$0.07035 will become a potential target.
Support and Resistance
Support Resistance $0.08461 $0.10963 $0.07729 $0.13624 $0.07035 $0.15539 EMA Level (Daily)
EMA Level 21 EMA$0.0932355 EMA$0.09513200 EMA$0.14347 Bull Market, Benchmark and Bear Market Scenarios
Scenarios set conditional levels Bullmarket Heavy volume closes above triangular resistance $0.10963-$0.15539 Benchmark Prices integrate around triangular resistance $0.093-$0.100 Bear market Rejected from resistance, falling below triangular support $0.08461-$0.07035 Glossary
Asymmetric triangle : Formed when a falling resistance line and a rising support line squeeze prices into a narrow range. No matter which direction, the final breakthrough is often substantial because of this compression.
EMA (Exponential Moving Average): The exponential moving average. It gives more weight to recent price behavior than old data and therefore responds faster than simple moving averages.
RSI (Relative Strength Index): Tracking the speed and magnitude of recent price changes, allowing traders to determine whether momentum is accumulating or beginning to fade.
Support and resistance : Refers to the area where buying or selling pressure has repeatedly occurred in history and is strong enough to suspend or reverse price movements.
PI vs. Bitcoin
The price movements of PI coins still largely reflect the sentiment of the broader cryptocurrency market, rather than operating independently, and this connection with Bitcoin forms a key background for any Pi Network news involving price movements. When bitcoin is trading with firmer momentum, the above PI breakthrough or rejection scenarios tend to unfold with stronger force in either direction, reflecting that tokens at liquidity levels such as PI are still closely dependent on the overall market's risk appetite.
Methodology
This 2026 Pi Network price forecast outlook is based on OKX's daily K-line data, EMA and RSI readings, and the symmetrical triangle structure that has formed since July 2026. The scenario levels described above are associated with specific breakthrough or rejection conditions and are not guaranteed results, especially given the introduction of real event-driven variables in Protocol 27 this month.
Expert opinion
Market commentators focusing on the PI market layout point out that symmetrical triangles are resolved just around major upgrade dates, which is a fairly common pattern, as expectations themselves tend to increase the volume of transactions that break through the window. They believe that the actual delivery of Protocol 27-including smart contracts, DEX and AMM infrastructure, and improved liquidity-may be more important than the announcements themselves to sustaining any price movement, as the market tends to price expected news ahead of events.
Disclaimer
This Pi Network price forecast is for information purposes only and should not be regarded as financial advice. The cryptocurrency market is extremely volatile, technical forms may not develop as expected, and any of the above scenarios may not occur. Readers should conduct independent research before making any investment decisions.