Exchange Ranking
 Top Exchanges
 24h Volume Ranking
 Popularity Ranking
 Exchange BTC Balance
 Proof of Reserves
 Decentralized Exchanges
 Funding Rate
 Funding Heatmap
 Liquidation Data
 Max Pain
 Long/Short Ratio
 Whale L/S Ratio
 Binance/Okex/Huobi L/S
 Bitfinex Margin L/S
 ETF Tracker
 Solana ETF
 XRP ETF
 Hong Kong ETF
 Bitcoin Treasuries
 Crypto Reversal
 Ethereum Reserves
 HyperLiquid Wallet Analysis
 Hyperliquid Whale Watch
 Large Transactions
 On-chain Movement
 Bitcoin ROI
 Stablecoin Market Cap
 Options Analysis
 News
 Articles
 Economic Calendar
 Features
 Wallet
 Contract Calculator


 Security
 Collections
 Watchlist
 Following
 XLM
XLM tests $0.294 resistance, breaking through or pointing to the downtrend line
XLM appears to be testing the $0.294 resistance level. If this level is effectively exceeded, prices are expected to rise further, moving towards the blue downtrend line above it. Although derivatives trading remains active on major exchanges, recent trading volumes have fallen below previous peaks. The weekly structure shows a convergent trend line, which means that the next sustained breakthrough or rejection will become increasingly important in guiding the direction of the market.
XLM's weekly chart pattern is tightening and prices are approaching important resistance areas, but trading volume is shrinking. This phenomenon reminds traders to seek more solid confirmation signals before the close.
$0.294 remains the key technical barrier
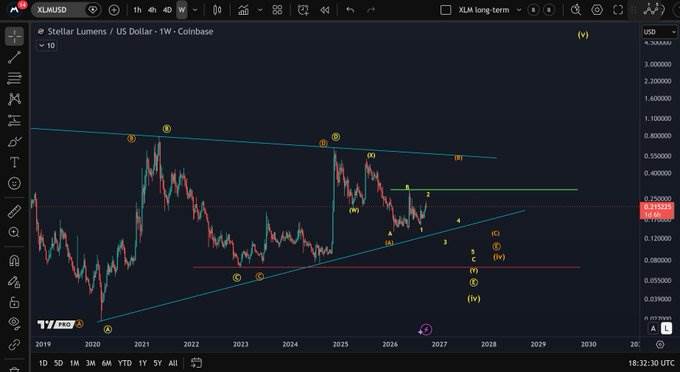
More Crypto Online identifies $0.294 as the next key resistance level. If weekly closing prices can break this threshold, the technical outlook will improve. At that time, the market's attention may shift to the blue downtrend line above.
Weekly charts show that XLM has gone through multiple stages of expansion and correction in recent years. After a rising market in 2021, XLM has entered a deep bear market trend. A broader recovery followed in 2023 and 2024. However, the recovery has been tested by multiple resistance areas on the weekly chart. The green horizontal line in the chart marks another barrier above the current resistance level. Therefore, even if a breakthrough is achieved, it will still face additional technical resistance from above.
As of writing, according to CoinGecko, the price of XLM is $0.2151. This leaves XLM still below the $0.294 resistance level identified by More Crypto Online. The distance between these two levels makes resistance factors a core focus of the current market structure.
Volume history shows repeated market expansion
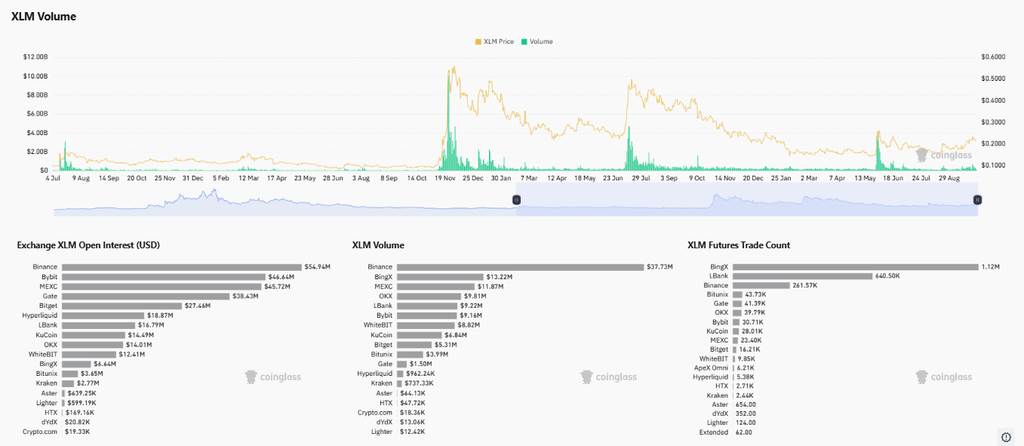
Volume charts record several periods of exceptionally strong market activity. The biggest expansion occurred around November 19, when accompanied by a sharp rise in prices, the average daily transaction volume was close to US$10 billion, and the XLM price once exceeded US$0.50. The rally eventually reversed after hitting the 0.50 - 0.55 region, before prices entered a long downward channel in December and January. There were several smaller volume increases during the broader correction period.
Another significant surge in volume in the chart occurred in late July. During the price recovery, trading activity once again reached the multi-billion dollar level. However, subsequent declines suggest that this momentum cannot be sustained. Recent trading volumes are much lower than earlier market surges, creating a relatively calm backdrop for the current technical structure. Any confirmed breakthrough above the resistance level may be accompanied by a re-expansion of volume.
Derivatives activity maintains active market positioning
Derivatives data shows that Open interest on a number of major exchanges is considerable. Binance led the lead with XLM open interest of approximately $54.94 million, followed by Bybit with $46.64 million, and MEXC recorded $45.72 million. Gate holds approximately $38.43 million, while Bitget holds approximately $27.46 million. These data suggest that derivatives participation continues despite recent declines in trading volume. This position also provides background for potential short-term fluctuations near resistance levels.
Among the derivative types displayed, Binance's XLM trading volume is approximately US$37.73 million. BingX ranked second with US$13.22 million, and MEXC reached US$11.87 million. OKX and LBank also registered significant trading volumes on the exchanges shown. BingX led the way with approximately 1.12 million futures transactions, followed by LBank with approximately 640,500 transactions, and Binance recorded a record of 261,570 transactions. At present, the $0.294 level is still the core focus of the weekly technical structure.