Exchange Ranking
 Top Exchanges
 24h Volume Ranking
 Popularity Ranking
 Exchange BTC Balance
 Proof of Reserves
 Decentralized Exchanges
 Funding Rate
 Funding Heatmap
 Liquidation Data
 Max Pain
 Long/Short Ratio
 Whale L/S Ratio
 Binance/Okex/Huobi L/S
 Bitfinex Margin L/S
 ETF Tracker
 Solana ETF
 XRP ETF
 Hong Kong ETF
 Bitcoin Treasuries
 Crypto Reversal
 Ethereum Reserves
 HyperLiquid Wallet Analysis
 Hyperliquid Whale Watch
 Large Transactions
 On-chain Movement
 Bitcoin ROI
 Stablecoin Market Cap
 Options Analysis
 News
 Articles
 Economic Calendar
 Features
 Wallet
 Contract Calculator


 Security
 Collections
 Watchlist
 Following
 BTC
Bitcoin bucked the trend and broke the historical curse: September performed strongly, and the transformation of institutional buyer identities was the key.
In September 2026, Bitcoin closed at US$83,556, an increase of 6.4%, setting its best September performance in history. This result was in stark contrast to the pessimistic trend widely expected at the time. Historically, September is usually the worst performing month for Bitcoin; since 2013, it has risen every August, and then September has tended to fall (i.e., the "Red September"). In August 2026, Bitcoin surged 25%. In addition, the macroeconomic outlook also points to downside risks: U.S. 10-year Treasury yields climb to their highest level since 2007. When risk-free government debt provides such high returns, money is usually withdrawn from assets that have no return.
Despite multiple pressures such as intensified selling of U.S. bonds, oil prices exceeding US$100 per barrel, and further interest rate hikes in market pricing, Bitcoin still showed strong resilience and remained tightly within the range of US$82,000 to US$84,000 for a week and a half. The key factor supporting this trend is the structural change in buying power this month: the spot Bitcoin ETF attracted $2.65 billion in inflows. What changes the situation is not the macro environment, but the identity of the buyer.
Why September was once regarded as Bitcoin's "darkest moment"
According to CoinGlass, September has been the weakest month for Bitcoin since 2013, with an average decline of 2.87% and a median loss of 2.44%. It should be noted that the median loss reflects the median result, while the average is distorted by extremely abnormal months.
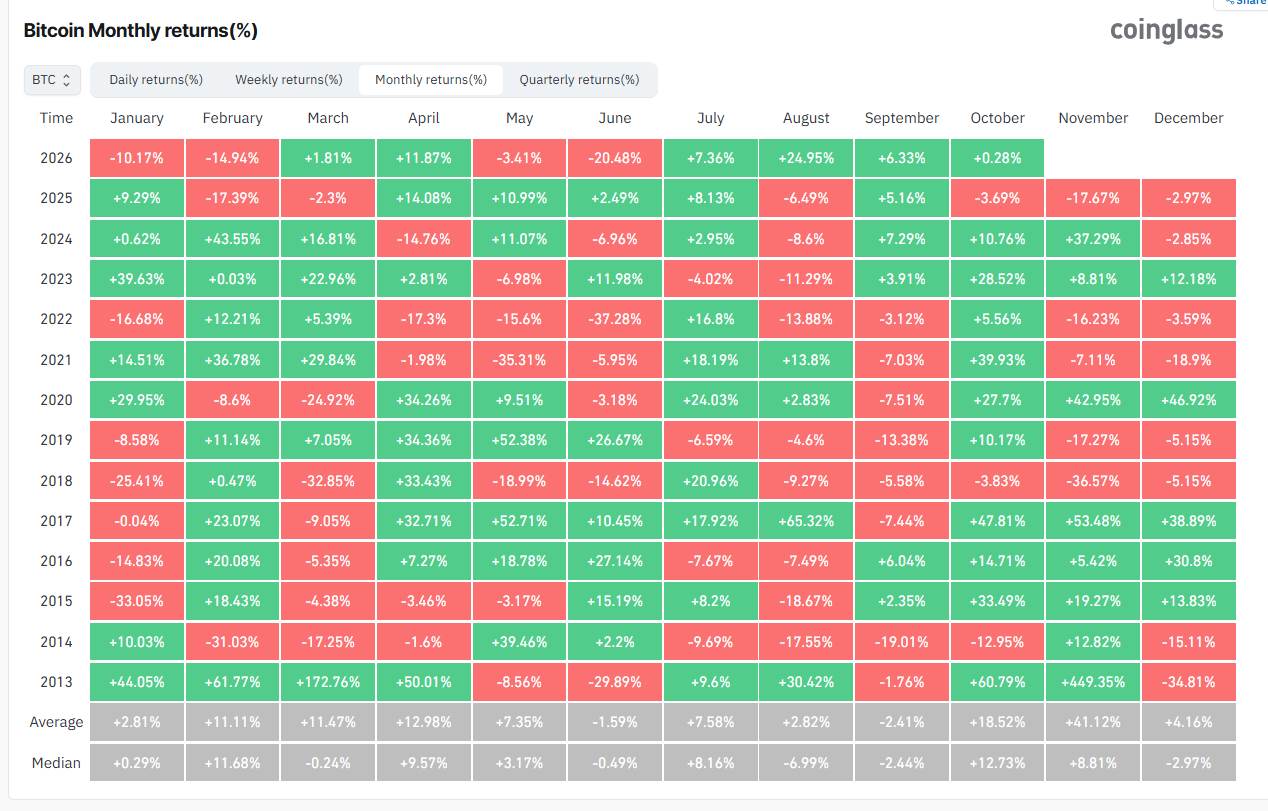 Source: CoinGlass #@0_13#@
Macroeconomic bearish arguments against Bitcoin have reached their strongest strength in recent years. The 10-year Treasury yield climbed about 50 basis points this month, rising from just under 4.8% in the first week to 5.29% on September 29.
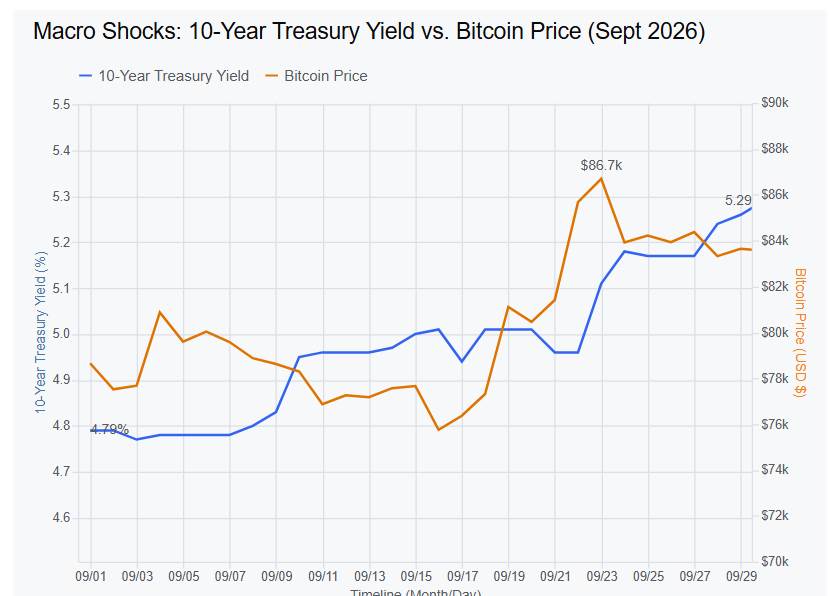 Source: YCharts
In early September, Brent crude oil prices hovered around US$99 a barrel as hostilities in the Middle East escalated involving Israel, Iran, regional proxies and the United States. Continued energy cost pressures directly pushed up broader inflation expectations and exacerbated global macroeconomic uncertainty at the beginning of the month. A University of Michigan survey showed annual inflation expectations jumped to 4.6% in September from 4.0% in August.
The rise pushed the 30-year fixed mortgage rate to 7.03% at the end of September, the highest level since April 2024. Bond markets are repricing everything in one go, which explains why Bitcoin's refusal to follow the decline seems so unusual and deserves in-depth analysis.
Peter Schiff argued in mid-September that Bitcoin completely failed its "digital gold" test. He noted that higher yields would attract capital to safer assets and warned that 10-year rates could reach 6%.
Looking back at 2022, as the Federal Reserve aggressively tightened monetary policy, the 10-year yield more than doubled to 3.88%, and Bitcoin plunged 64% in the same year.
Why old trading logic fails
In financial terms,"duration" measures the sensitivity of asset prices to changes in interest rates. When interest rates or Treasury yields rise, high-growth, long-term technology stocks often take a hit because their future earnings are worth less today. By getting rid of its linkage with technology stocks, Bitcoin has avoided a sharp sell-off of interest-sensitive assets, and its trading characteristics are more like a tool to hedge against rising yields and currency depreciation than high-risk technology investments.
According to Grayscale Research, the 90-day rolling correlation between Bitcoin and the Nasdaq index has dropped from more than 60% at the beginning of 2026 to about 33%, while the correlation with gold has climbed to more than 50%. CoinShares data also puts Nasdaq's correlation at its lowest point since 2024.
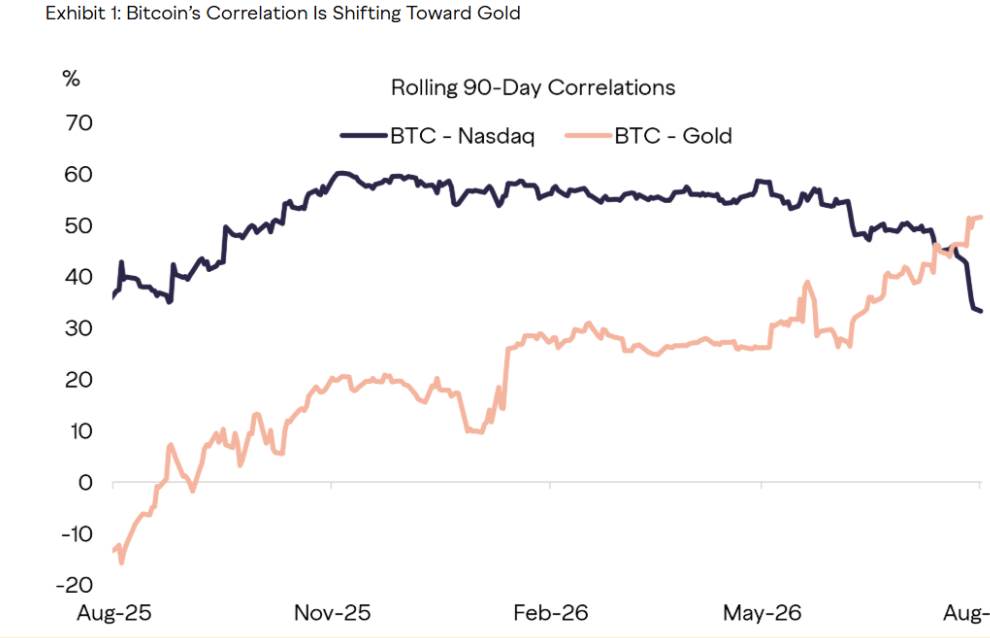 Source: Grayscale Research
Fed rate hikes are usually bad for Bitcoin. However, as Markus Thielen, founder of 10x Research, explains, market dynamics change when yields rise due to fiscal concerns and term premium risks rather than Fed tightening policies. Since the end of 2023, the 10-year Treasury yield has climbed 135 basis points, while the price of Bitcoin has almost doubled, a divergence that traditional bearish arguments have failed to account for.
Who is buying when the market is expecting a sell-off?
Institutional buying drove the rally, but it entered in a late and pulsed manner rather than a daily steady inflow expected by the market consensus.
According to Farside Investors, the flow of funds in the spot Bitcoin ETF remained negative until mid-month, recording a net outflow of approximately US$450 million on September 15 and US$296 million on September 16. However, the continuous inflow surge for the week starting September 17 increased by approximately US$6.6 billion, with a single-day net inflow on September 21 approaching US$1 billion, marking the best one-day performance since October 2025.
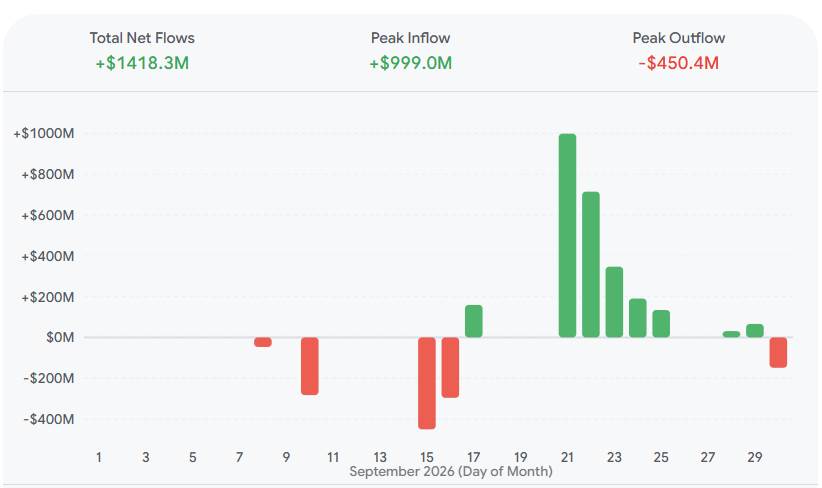 Source: Farside Investors
As of September 22, the cumulative capital flow during the year turned positive for the first time, and this was the first time since May 26. Strategy (formerly MicroStrategy) purchased 2,615 bitcoins in two transactions in September at a total cost of US$218.4 million, bringing its total position to 847,666 bitcoins at a total cost of approximately US$63.95 billion. Although this total amount is huge, it is only equivalent to one-fifth of the single-day inflow of a strong spot Bitcoin ETF. The company also sold some of its Bitcoin in late July and early August, its first sale since adopting the treasury strategy in 2020.
Meanwhile, Bloomberg ETF analyst James Seyffart estimates that the average cost base for ETF holders is about $81,722, which is in line with key support levels repeatedly defended by institutional buyers.
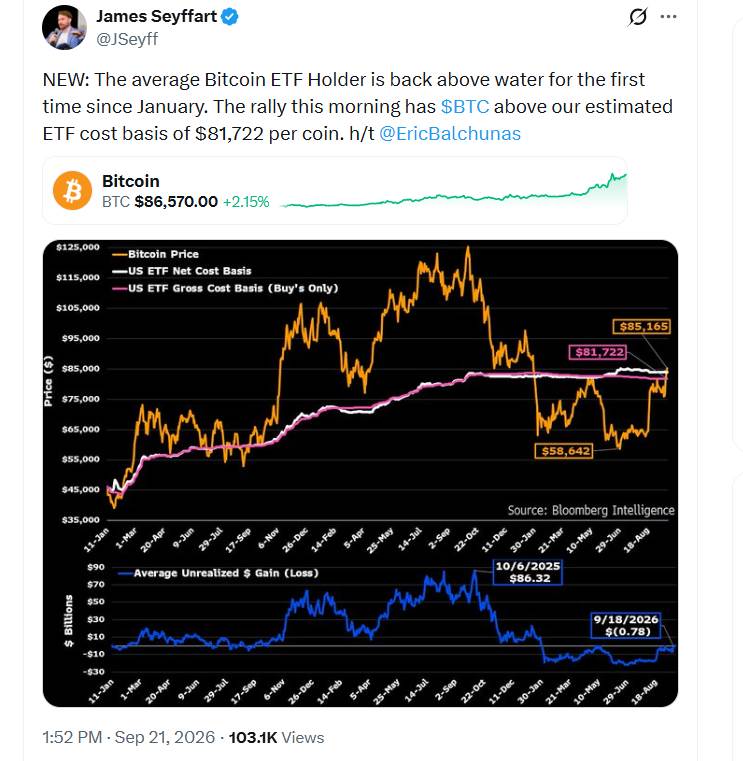 Source: X
Industry Comments and Reactions
Julio Moreno, head of research at CryptoQuant, points out that prices have "hollowed out" at the bottom. Speculative futures demand collapsed by about 90% in 15 days, falling from about 164,000 BTC on September 14 to 16,000 BTC on September 29. Recent buyers have an average of 33% of unrealized gains, the highest level since December 2024. On September 22, holders realized profits of approximately 25,700 bitcoins, which was the largest total profit in a single day of the year. Moreno believes that without new demand, the rebound will be difficult to continue.
Sonali Gupta, head of research at AMINA Bank, proposed a clearer test than any price target: If Bitcoin stabilizes in the-86,000 range and ETF flows remain positive, it indicates that September's market is turning into a broader recovery; if funds flows reverse and prices continue to fall below that range, the bullish reasons will weaken. She also pointed to a noteworthy divergence: While gold is defending technical standards, Bitcoin is absorbing institutional funds, and the two assets are now competing for the same role.
On the morning of the close, CEX.IO set the threshold for Bitcoin's best September in history at around $83,600, the trading price at the time, and asked followers whether this was a recording month or an adjustment setting. A clean close above $83,600 would be a perfect finish, one trader said, but that's all.
US$83,600.
That's the closing price Bitcoin needs today to create the best September price in its history.
That's where it's currently trading-the worst performing month in crypto history.
Is it a record month or an adjustment setting? Please express your opinion.
- CEX.IO (@cex_io) September 30, 2026
Why altcoins did not rebound with Bitcoin
On September 28, Bitcoin accounted for 58.5% of the total cryptocurrency market value, and the total market value was approximately US$2.88 trillion.
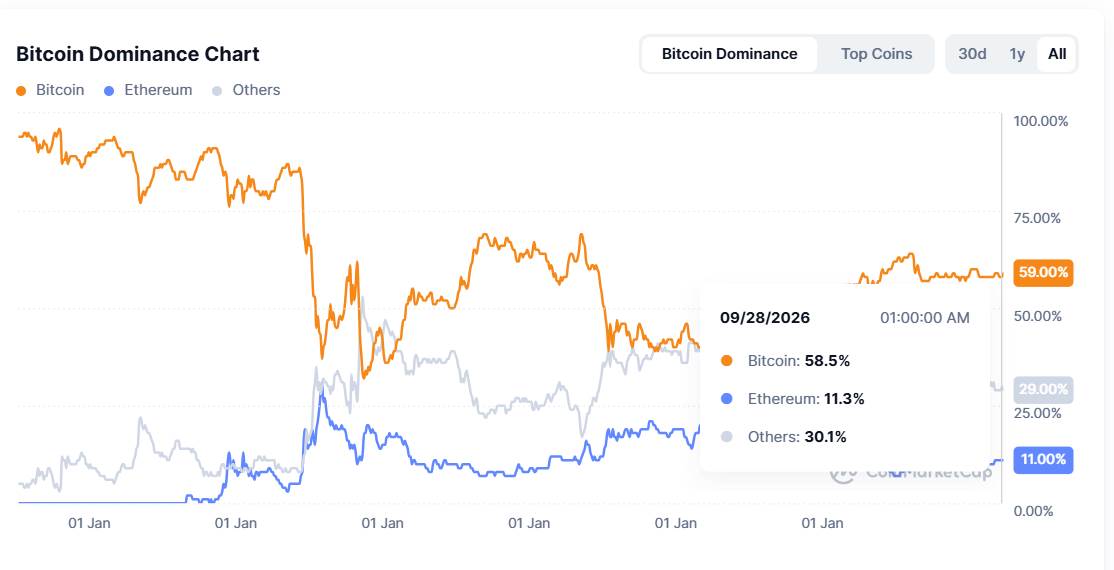 Source: CoinMarketCap
CoinMarketCap's Altcoin Seasonal Index (which calculates how many of the top 100 currencies have outperformed Bitcoin in the past 90 days) is located near 63, still in the "Bitcoin Season" realm.
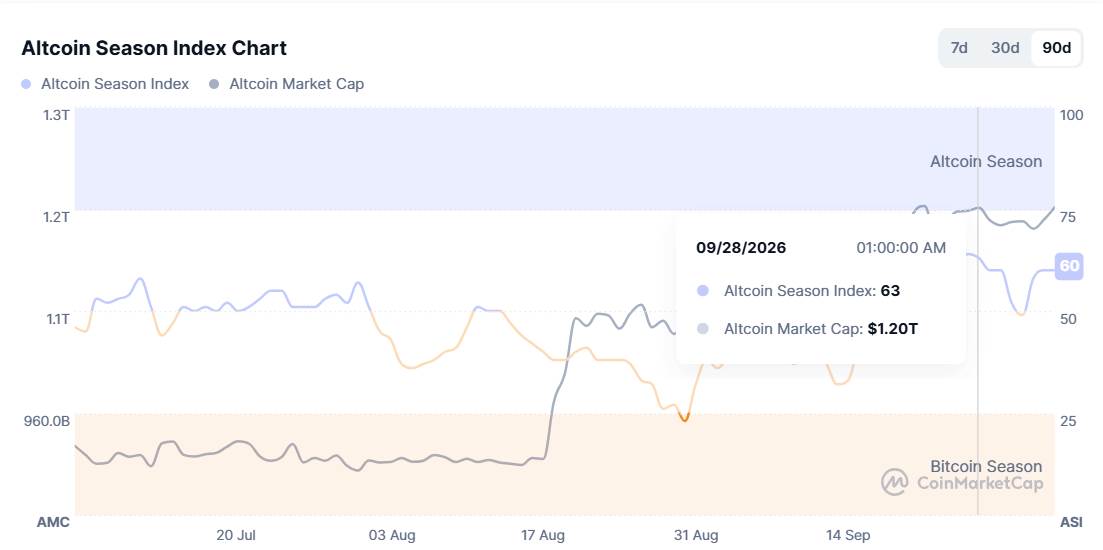 Source: CoinMarketCap
Although broad market indices show weak performance on average, funds are not completely absent, but are highly concentrated. Instead of creating a broad market rebound, investment was selectively shifted to specific assets: within three months, Zcash surged by about 295%, and Uniswap rose by 248%, both outperforming Bitcoin's 44% gain.
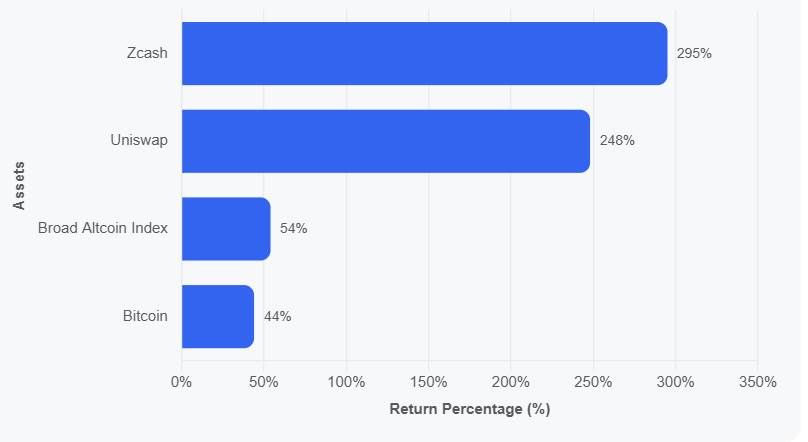 Source: CoinMarketCap
The broader altcoin market lags behind Bitcoin due to structural supply dynamics and high concentration of market liquidity. One of the main factors is the pervasive token economics model adopted by recent crypto projects, characterized by low initial circulation supply and high fully diluted valuation (FDV).
Under this structure, the agreement releases only a small portion of its total supply on the open market, while retaining large shares for early investors, team members, and ecosystem treasuries, which are limited by vesting periods. As these planned token unlocks occur, millions of dollars of new supply are systematically injected into the market each month, creating sustained selling pressure and dampening price increases regardless of overall market sentiment.
What exacerbates this oversupply is the way funds are deployed during this cycle. The main vehicle driving current market inflows-institutional spot ETFs-are structurally restricted to buying Bitcoin (and key assets such as Ethereum), preventing funds from naturally rotating down the risk curve to long-tailed altcoins as in previous bull markets.
As a result, global market liquidity is closely concentrated in high-confidence established assets with institutional access, resulting in an underfunded broader altcoin sector that cannot match Bitcoin's upward momentum.
However, some industry reviews still hold out hope for altcoins. Pledged infrastructure provider Everstake pointed to the revival of altcoin activity as a source of further strength in the broader market in its September review. Historically, when money flows into Bitcoin, it eventually flows down the risk curve.
Traditional markets have experienced September, but Bitcoin is different.
In the past five weeks, Bitcoin has risen 6.3%, while the S & P 500 index only edged up 0.3% in September, and gold fell 6.5%.
As you can see, the stock market is basically sideways, and gold is weakening. Bitcoin continues to accumulate momentum, the broader crypto market also participates, and money flows back into digital assets. This trend was supported by stronger market demand, including large inflows of U.S. spot Bitcoin ETFs in September and continued institutional hoarding, with Strategy adding an additional 1,665 bitcoins to its treasury.
Macroeconomic conditions have also become more supportive. Lower-than-expected inflation data in August briefly depressed Treasury yields and reduced expectations of another Fed rate hike, creating a more favorable backdrop for risky assets. After months of depressed sentiment and heavy short positions, the crypto market reacted particularly strongly.
Now that the fourth quarter begins, Bitcoin enters with stronger momentum than stocks or gold, and ETF demand, institutional hoarding, improved regulatory clarity and renewed altcoin activity are adding strength to the broader market structure.
- Everstake (@everstake_pool) October 2, 2026
Fourth quarter outlook: Key points:
closed at US$83,554. September became Bitcoin's highest monthly closing price in 2026, higher than May's high of US$82,792, and returned to above the 12-month moving average of US$77,889, while the 20-month average of US$87,281 became the current upper resistance level. Analyst Quinten François described the next test as: "Hold on to $82,800 and recover $87,300, and the case for hitting $100,000 will become very strong."
Bitcoin has just printed its highest monthly closing price for 2026
The reverse situation is even more important because if the closing price falls back below $82,800, the previous breakthrough will be completely offset.
Price significance $87,000-$90,000 September high of $87,363 (September 21); Unbroken resistance $83,000-$84,000 Trading range in late September ~$81,700 Average cost base for ETF holders $75,000 Maximum pain point due in September Futures open interest contracts have rebounded to nearly US$60 billion, after being in the range of around US$45 billion in June and July, while options open interest contracts pushed higher to more than US$50 billion, It is the highest level since the end of 2025, much higher than the approximately US$25 billion at the end of June.
Tillen's case for a 6% yield is based on arithmetic rather than emotion: the 10-year yield is around 5.24%, while nominal GDP growth is around 6.56%, and federal debt has grown by about 8.5% annually since 2020. Based on this gap, he believes that there is still room for upside in yields, and within his framework, this does not automatically constitute a negative for Bitcoin.
If ETF subscriptions remain at the pace of late September and Bitcoin recovers $87,000, the next key resistance level is at $90,000. Conversely, if inflows slow and open interest on derivatives remain high, accumulated leverage could quickly unwind, bringing $81,700 back into focus. The historical average return in October was approximately 19.92%, but this relies on limited historical data and should not be seen as a guarantee.
Finally, a note of caution: Bitcoin is still about 4.4% below its starting price in 2026 of approximately US$87,497, and well below its historical high of US$126,210.50. A strong September does not actually mean that the market has recovered.
The September results provide a rather subtle signal, as Bitcoin's performance is largely sustained by continued demand for institutional ETFs rather than broader retail participation. Whether these institutional flows will continue into the fourth quarter will be a key factor in determining the direction of the market.