Exchange Ranking
 Top Exchanges
 24h Volume Ranking
 Popularity Ranking
 Exchange BTC Balance
 Proof of Reserves
 Decentralized Exchanges
 Funding Rate
 Funding Heatmap
 Liquidation Data
 Max Pain
 Long/Short Ratio
 Whale L/S Ratio
 Binance/Okex/Huobi L/S
 Bitfinex Margin L/S
 ETF Tracker
 Solana ETF
 XRP ETF
 Hong Kong ETF
 Bitcoin Treasuries
 Crypto Reversal
 Ethereum Reserves
 HyperLiquid Wallet Analysis
 Hyperliquid Whale Watch
 Large Transactions
 On-chain Movement
 Bitcoin ROI
 Stablecoin Market Cap
 Options Analysis
 News
News Articles
 Economic Calendar
 Features
 Wallet
 Contract Calculator


 Security
 Collections
 Watchlist
 Following
 DOGE
DOGE TLDR
TD sequence signal and chart pattern
- Whales are attracting funds near support.
- DOGE fell more than 17% from a high close to US$0.1007 on August 22 to around US$0.0828.
- analyst Ali Charts pointed out, The Dogecoin daily chart shows a TD series buy signal
- The morning star pattern is formed, which is usually a classic sign of weakening selling pressure.
- It is reported that whales have purchased 400 million DOGE units near the support level in the past five days.
- The $0.0813 area is the key; Holding this level may open up a rising path to $0.1552 and $0.1774
Dogecoin Price Dynamics: TD Sequence Signals and Chart Pattern
Dogecoin has recently retreated sharply from highs, and this decline has caused traders to pay close attention to signals that the skid is about to end. After hitting a high of about $0.1007 on August 22, DOGE fell more than 17% to around $0.0828.
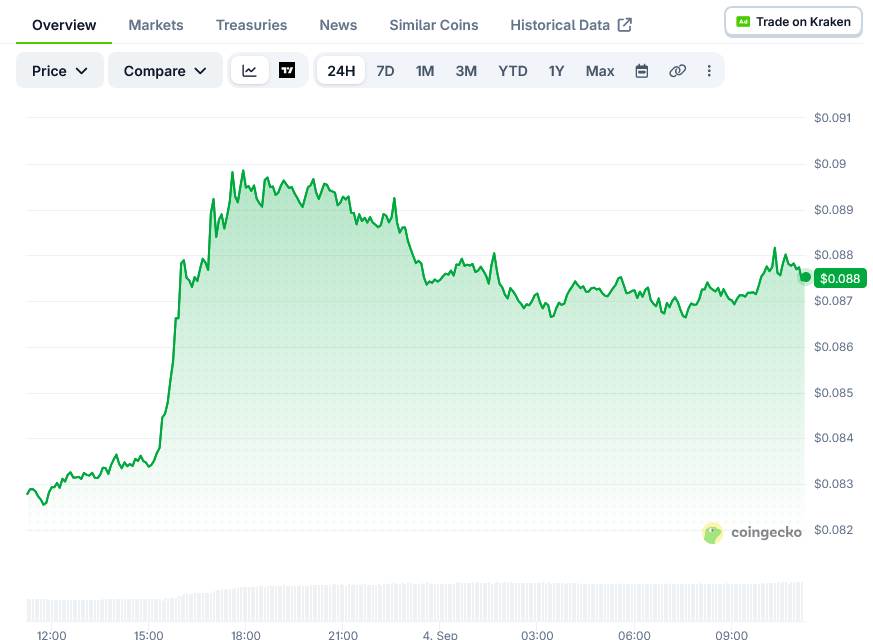
The decline brought prices closer to areas where large buyers had previously intervened. Chart observers say the area has historically been characterized by attracting demand.
One of the much-watched signals is the TD Sequential Indicator. This indicator is designed to mark the moment when trend momentum is exhausted.
Analyst Ali Charts announced on the X platform that a new TD series buy signal has just appeared on Dogecoin's daily chart. The tool is designed to identify exhaustion after long-term price movements, rather than ensuring immediate reversals.
Ali Charts also pointed out that a "morning star" pattern is being formed on the daily chart. This K-line pattern usually appears after a sell-off period, indicating that the market is shifting from clear bearish control to uncertainty.
In the same set of posts, Ali Charts mentioned that these signals often appear before the buyer begins to regain control of the situation. Analysts view the pattern as an early clue rather than a confirmed reversal.
Traders often want to see continued buying follow-up before they regard a single signal as a reliable basis. At present, this confirmation has not yet fully arrived.
Whales attract funds near the support level
Chain activity adds another layer of context to this story. Large holders have reportedly purchased approximately 400 million DOGE units in the past five days.
These purchases occur near the support area that many traders watch closely. According to on-chain data cited in the report, approximately 35 billion DOGE units had changed hands in the same area.
Such a large trading volume can mark areas where holders are reluctant to sell. If broader market sentiment turns positive, new buying there could also increase liquidity.
Currently,$0.0813 is considered a "life-and-death line." Hold above that price and the reversal logic is maintained.
A break below this level will weaken the above bullish pattern. So far, the buyer has successfully defended this area.
If DOGE stabilizes and buying continues, the next mentioned targets are $0.1552 and $0.1774. To reach these levels, we first need to break through the resistance level in the middle.
As of the latest update, DOGE is still hovering in the range of US$0.0828 to US$0.0813, and traders are waiting for confirmation of the reversal signal.